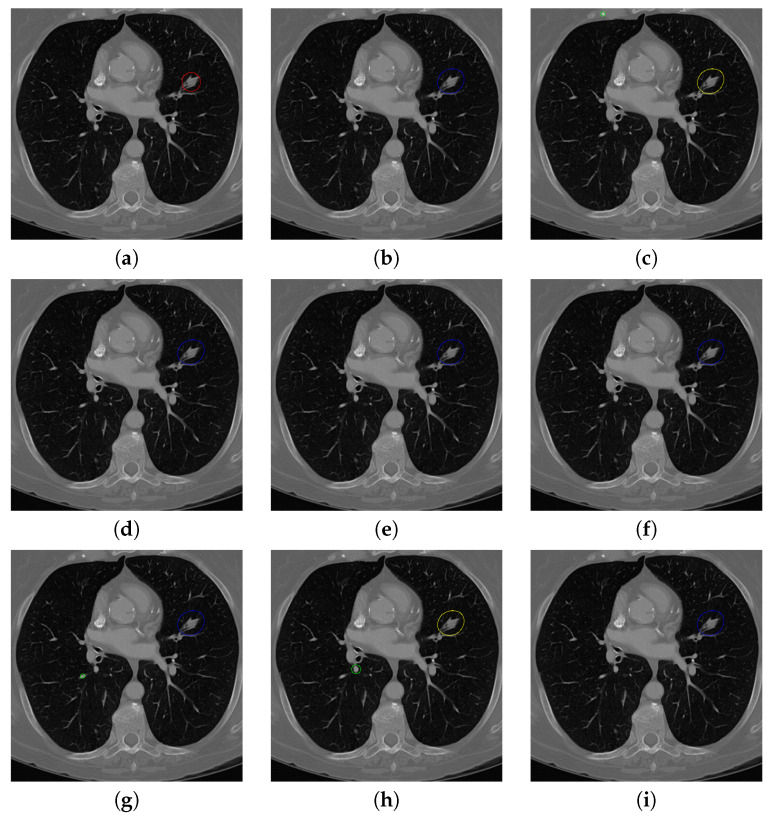
Figure 19.
The result of detecting pulmonary nodules by different methods on one example image in TianChi dataset. Red circle represents the ground truth region of nodules, blue circles represent the correct estimation of pulmonary nodules, green circles represent the over-detected nodules, while yellow circles denote the nodules being omitted. (a–i) are: ground truth nodule in the given chest CT image, nodule detected by 3D-FCN, MR-CNN, 3D-UNET, PRN-HSN, DCNN, CLAHE-SVM, MASK-RCNN and our proposed method.

