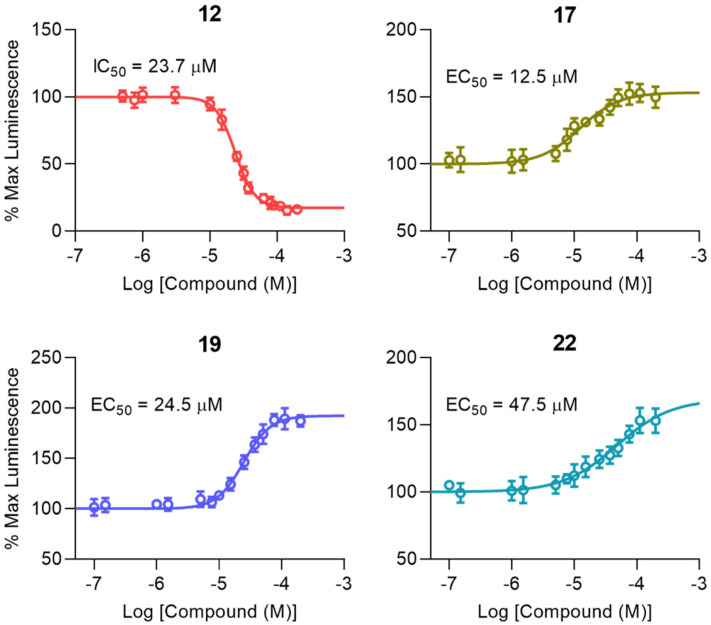
Figure 3.
Dose response curves of top FGF14:Nav1.6 complex modulators. To determine potency (IC50 or EC50) and efficacy (percent luminescence at the bottom or top plateau for inhibitors (IMin) or enhances (EMax), respectively) each compound was tested at 14 concentrations (range: 0.25–175 µM; n = 4 replicates per concentration) using the LCA in 96-well plates. Data are shown as mean percent luminescence (relative to per plate 0.5% DMSO controls) values ± SEM. Non-linear regression curve fitting was performed using GraphPad Prism 8 to determine potency and efficacy values for each compound, as shown in Table 2.

