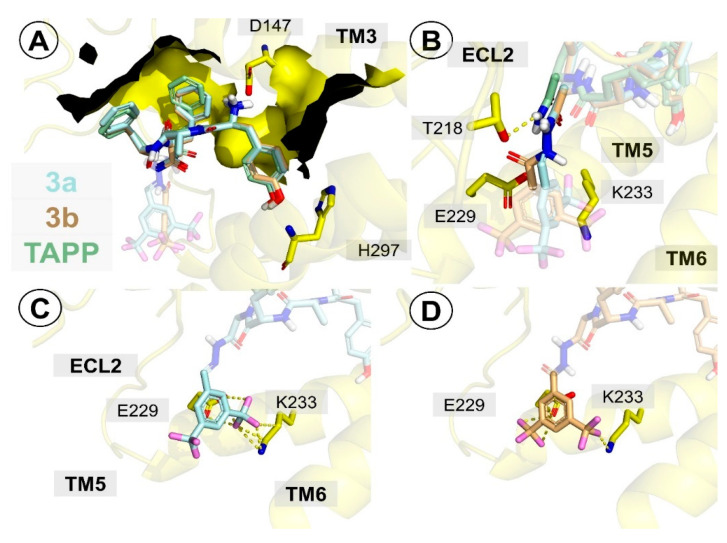
Figure 5.
Binding modes of compounds 3a (palecyan) and 3b (light orange) in the MOR binding site (yellow). The ligands are shown as colored sticks. Several residues and transmembrane helices (relevant for each picture) are shown and labelled. Yellow dotted lines represent interactions. (A) Both compounds superimposed on TAPP (pink, from 6DDF [43]). (B) Focus on the interactions with T218 and compounds 3a, 3b, and TAPP together. (C,D) Focus on the interactions with E229 and K233, as well as compounds 3a (C), 3b (D), and 1c (E).

