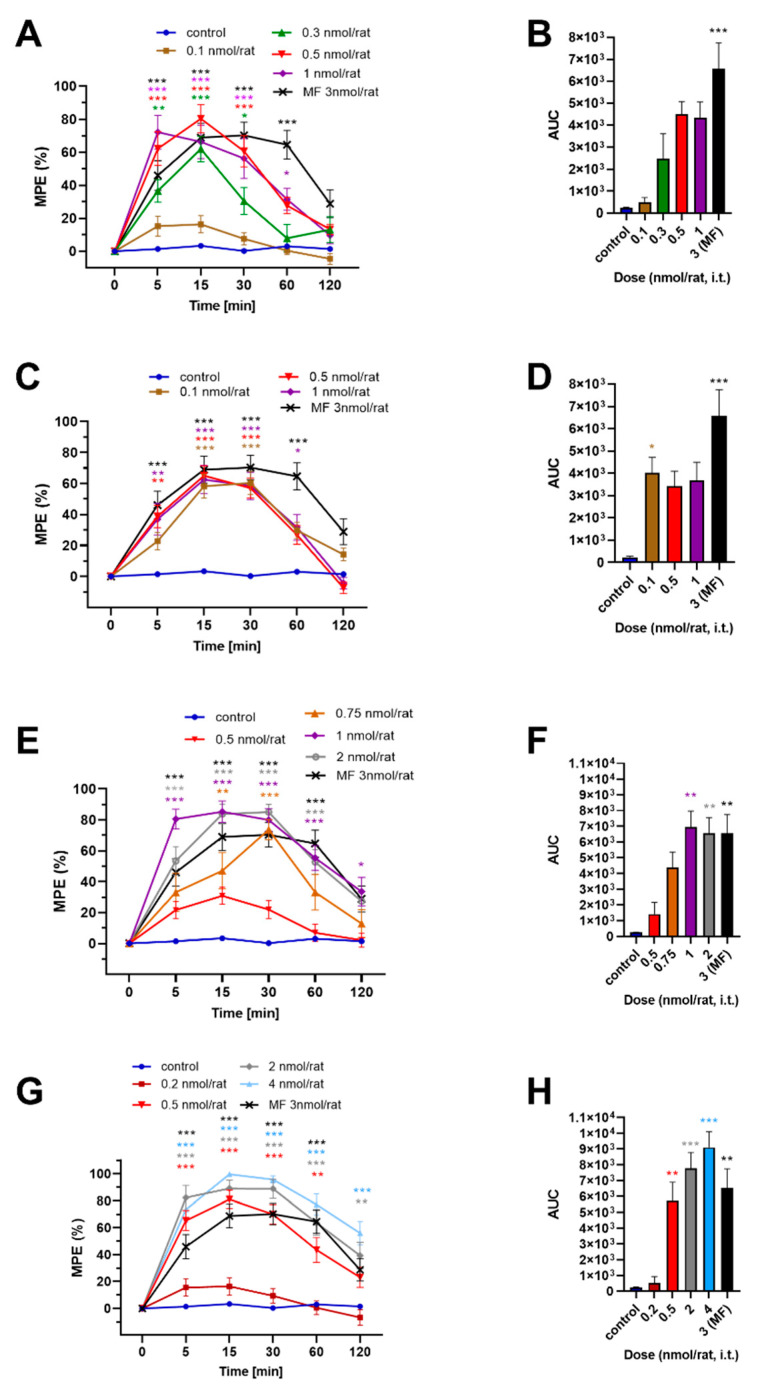
Figure 7.
Analgesic responses of compounds 1a (A,B), 1b (C,D), 1c (E,F), and 1d (G,H), as well as morphine (MF). In the left column given is the time course curve of the effect. In the right column are column plots of the area under the time course curve (AUC) for different doses. Results were either analyzed with two-way ANOVA followed by the Bonferroni post-hoc test (A,C,E,G) or one-way ANOVA followed by the Dunnett post-hoc test (B,D,F,H) and plotted as the mean ± SEM (n = 4–8). Asterisks (*) indicate a significant difference compared with saline-injected animals. Note: * p < 0.033, ** p < 0.002, and *** p < 0.001.

