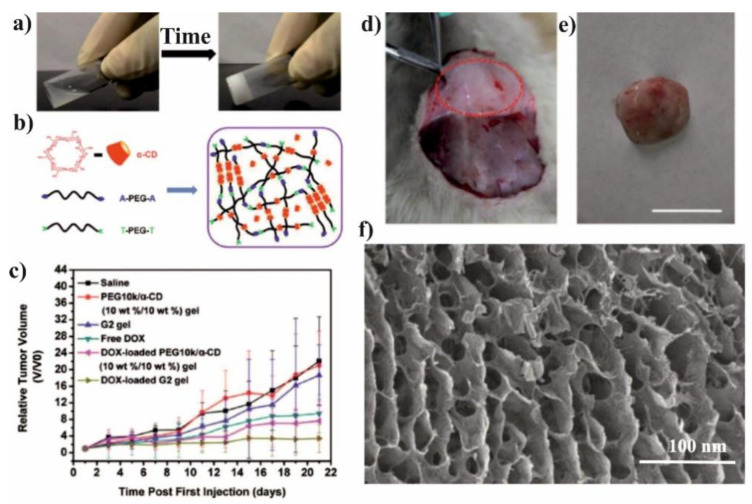
Figure 12.
(a) Photographs of an A-PEG10k-A/T-PEG10k-T/α-CD aqueous solution (PEG/α-CD, 10 wt.%/10 wt.% and a G2 hydrogel. (b) Schematic illustration of the gelation mechanism of the supramolecular hydrogel. Changes in relative tumor volume (c) and in relative body weight. Each solution was injected into xenograft-bearing mice (U14) after the initial tumor volume had reached 150–250 mm3. In vivo formation of the G2 hydrogel in the subcutaneous tissue after 30 min (marked as red-dotted curves) (d), the G2 gel removed from the rat (bar = 1.5 cm) (e) and the corresponding SEM of the lyophilized hydrogel (bar = 100 mm) (f). (Copyright 2013, RSC).

