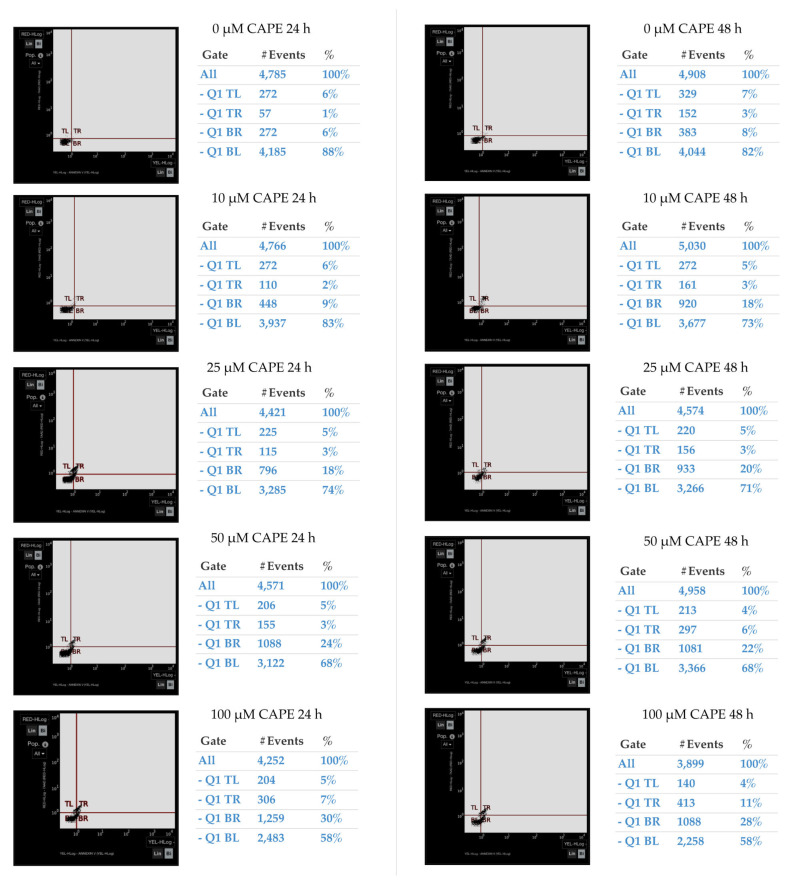
Figure 10.
Representative plots showing the apoptotic effect of selected CAPE concentrations on ovarian cancer OV7 cells after 24 and 48 h. Necrotic cells are shown in top left (TL) quadrant, late apoptotic phenotype cells are in top right (TR) quadrant, early apoptotic phenotype cells are in bottom right (BR) quadrant, and in the bottom left (BL) quadrant there are cells with live phenotype. Measured with the V-FITC/PI assay.

