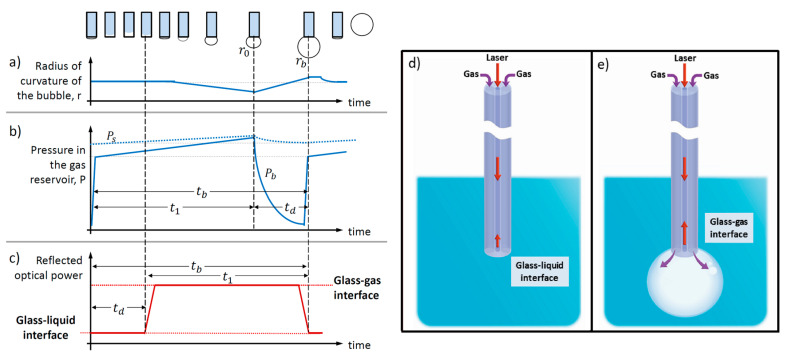
Figure 1.
Schematic diagram of the concept: in a typical maximum bubble pressure (MBP) measurement, the characteristic times involved in the process of bubble formation, from where the surface tension is inferred, can be measured by following the time evolution of either (a) the radius of the bubble or (b) the gas reservoir pressure. (c–e) The same characteristic times can be retrieved by following the time evolution of the optical power reflected from a small, partially transmitting interface located at the center of the capillary that is used to induce the formation of the bubbles. In that case, the continuous creation and detachment of bubbles due to the injection of gas at a constant rate will produce a train of pulses in the reflected signal (c) due to the difference in the reflectivity between (d) the glass–liquid interface versus (e) the glass–gas interface, which is around one order of magnitude for aqueous liquids. Similarly to an MBP measurement, the surface tension of the liquid under test can be measured indirectly from the characteristic times retrieved, i.e., from the characteristic periodicity of the train of pulses generated. Panels (a,b) were adapted from Refs. [15,16,17] (see text for details).

