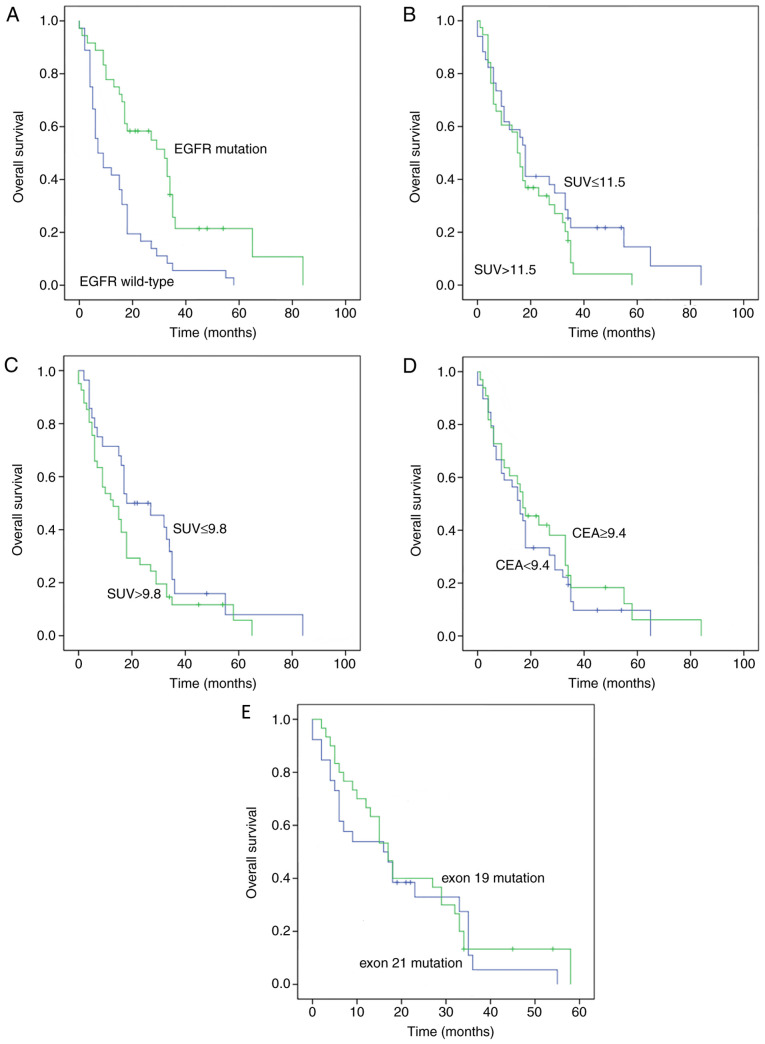
Figure 5.
Kaplan-Meier plot analyses. (A) OS time in terms of EGFR mutation. (B) OS time according to SUVmax in primary lesions. (C) OS time according to SUVmax in metastatic lymph nodes. (D) OS time according to CEA level. (E) OS time according to different EGFR exons. EGFR, epidermal growth factor receptor; SUVmax, maximum standardized uptake value; CEA, carcinoembryonic antigen; OS, overall survival.

