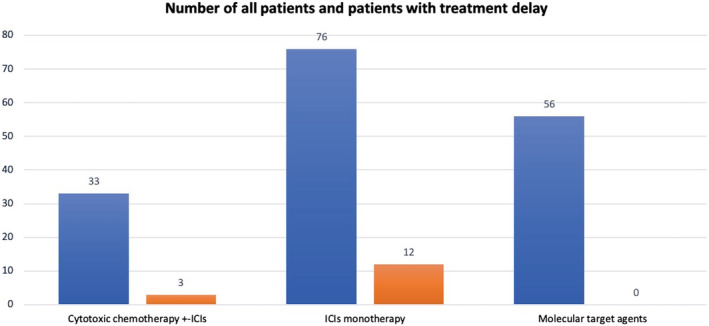
Figure 1.

Proportion of patients who delayed treatment according to treatment type. The blue bar indicates the total number patients who received each type of treatment. The red bar indicates patients associated with delayed treatment.  All patients,
  Patients with treatment delay.
