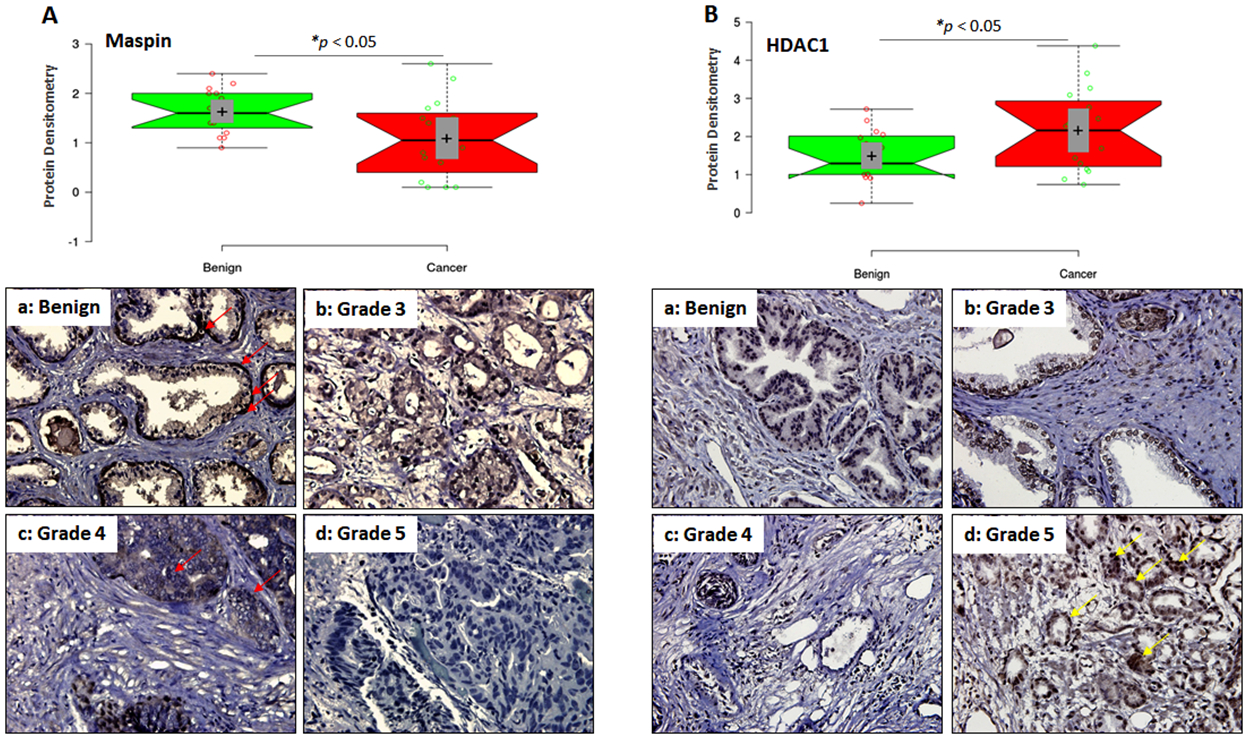
Figure 1:

Maspin and HDAC1 expression in benign and prostate cancer specimens. (A) Densitometic analysis of maspin normalized to GAPDH from 16 paired specimens shown in the boxplot. Bars ± SD, *p < 0.05, compared to benign tissue. Immunostaining for maspin in representative samples of benign prostate tissue and cancer specimens of various Gleason grades. Magnification ×400. Red arrow represents maspin expressing cells. (B) Densitometic analysis of HDAC1 normalized to GAPDH from 16 paired specimens shown in the boxplot. Bars ± SD, *p < 0.05, compared to benign tissue. Immunostaining for HDAC1 in representative samples of benign prostate tissue and cancer specimens of various Gleason grades. Magnification ×400. Yellow arrow represents HDAC1 expressing cells.
