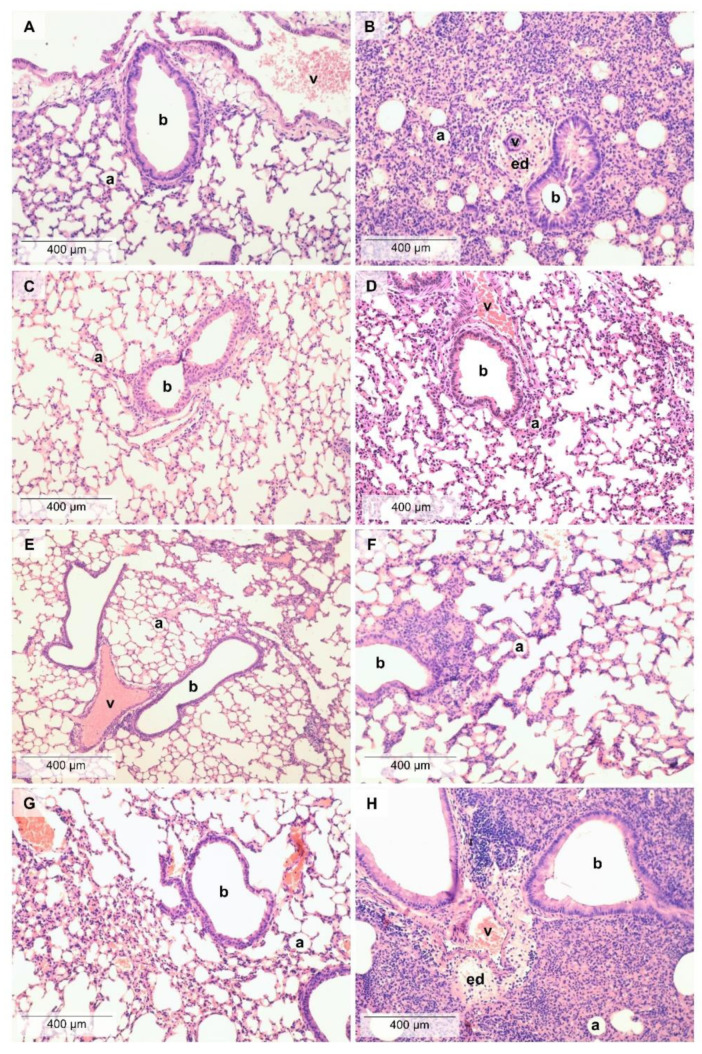
Figure 2.
Histopathological alterations in the lung. Representative pictures of lung parenchyma after (A) PBS and PO treatment, (B) LPS and PO treatment, (C) PBS and TO treatment, (D) LPS and TO treatment, (E) PBS and CO treatment, (F) LPS and CO treatment, (G) PBS and LO treatment, and (H) LPS and LO treatment. (Hematoxylin–eosin staining, 200 × magnification; a: alveolus, b: bronchiole, v: vessel, ed: edema).

