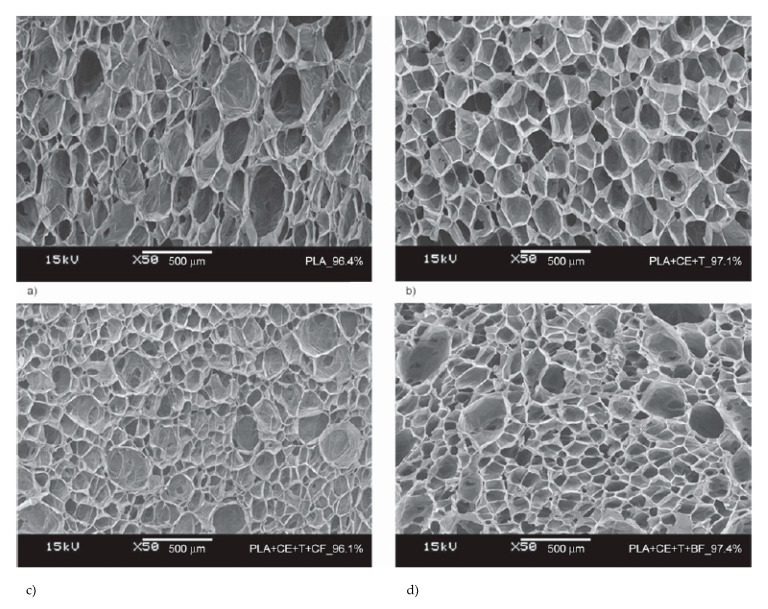
Figure 36.
SEM micrographs of the cell morphologies obtained for highly expanded (ε > 95%) PLA foams. (a) PLA, (b) PLA + CE + T, (c) PLA + CE + T + CF, and (d) PLA + CE + T + BF. Reprinted from Bocz et al. [150] with permission from Express Polymer Letters.

