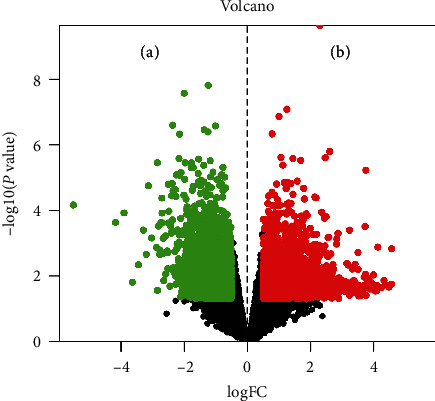
Figure 1.

Volcano map of the differential genes. The abscissa represents logFC, which is the fold change in the gene expression. The ordinate represents -log10(P value), which is the statistical significance of the change in gene expression. The green dots on (a) represent downregulated genes, and the red dots on (b) represent upregulated genes.
