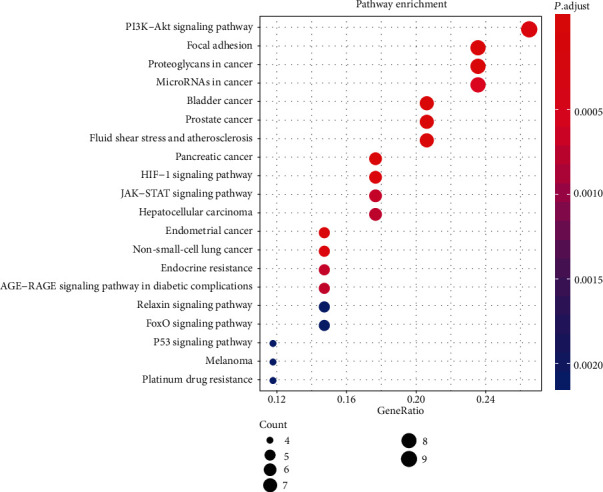
Figure 5.

KEGG pathway enrichment analysis. The top 20 significant pathways with FDR < 0.05 were identified. The abscissa represents the GeneRatio of the enriched genes and the ordinate represents the name of the enriched pathways. The size of the dots represents the number of genes, and the color represents the significance of the FDR value.
