
Figure 6.
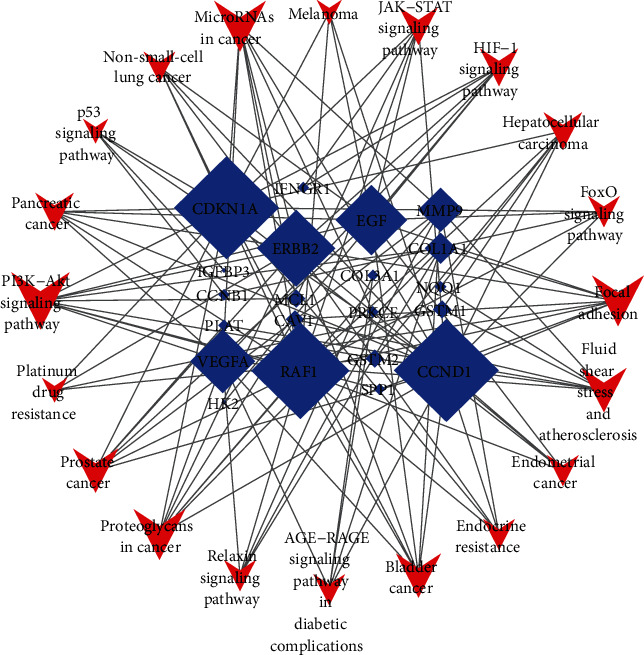
Gene-pathway network. Degree centrality (DC) was used to perform the topological analysis of the 20 pathways and 21 genes. The blue diamonds represent candidate genes and the red V-shapes represent pathways. The size of nodes represents the value of degree centrality.