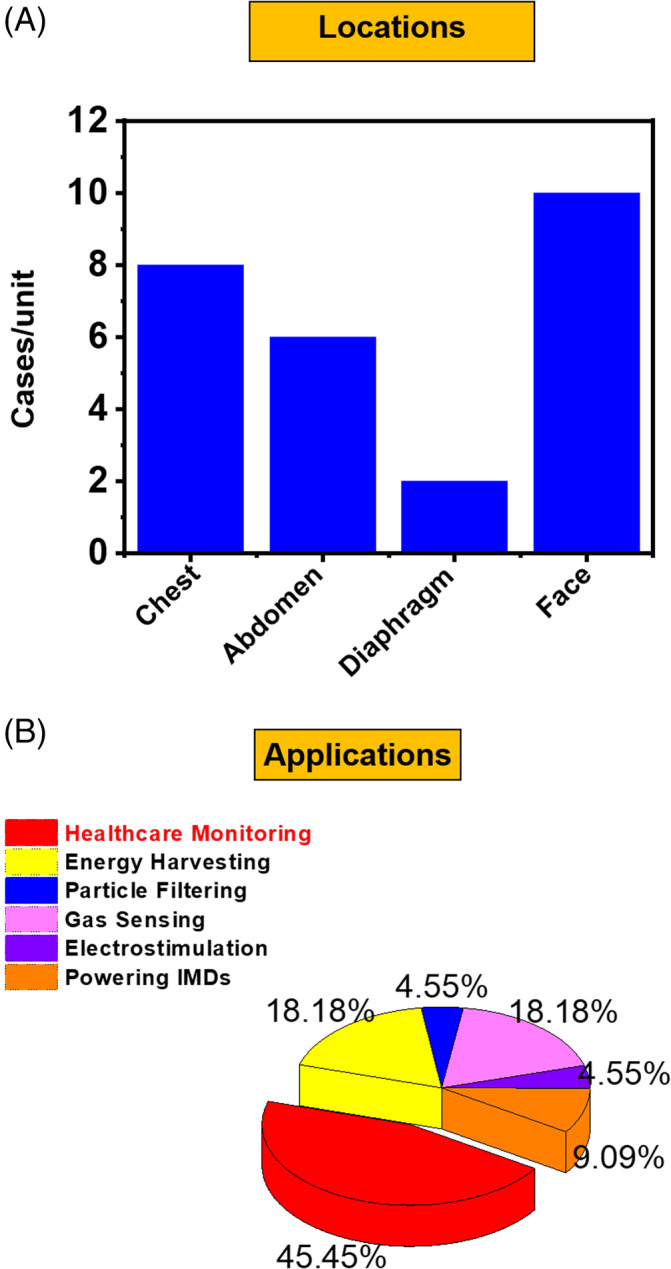
FIGURE 7.

Summary of respiration‐driven TENGs. A, Diagram showing the number of reports where a TENG was activated at different locations during respiration. B, Pie chart showing the percentage of different application demonstrations of respiration‐driven TENGs. TENG, triboelectric nanogenerator
