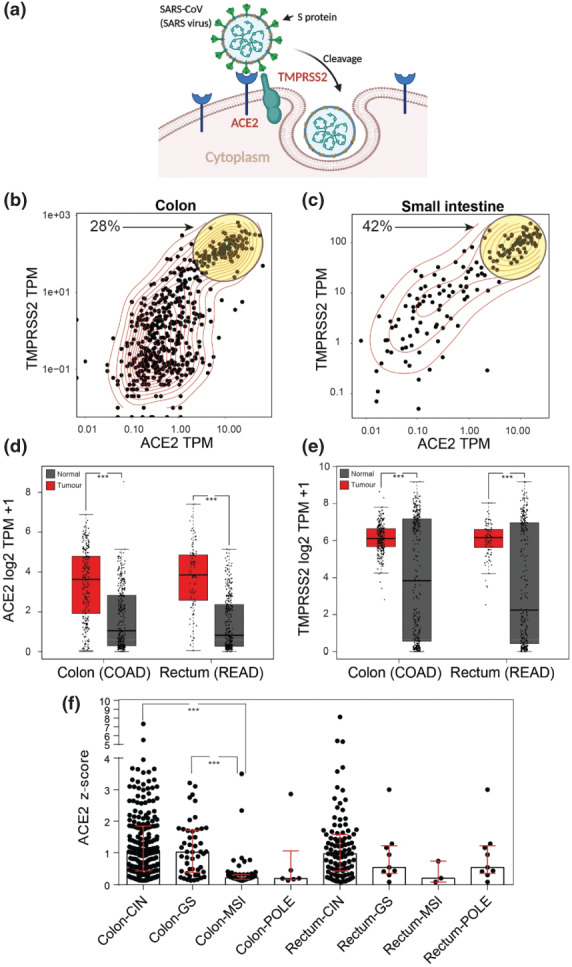
Fig. 1.
ACE2 and TMPRSS2 are expressed heterogeneously in the normal intestine and colorectal cancer

(a) Schematic demonstrating the mode of entry of SARS-CoV-2 into cells via interactions with the cell surface proteins ACE2 and TMPRSS2. (b) Scatter plot of the expression of ACE2 and TMPRSS2 across all colon GTEx samples. Yellow circle highlights high co-expressing samples. (c) Scatter plot of the expression of ACE2 and TMPRSS2 across all small intestine GTEx samples. Yellow circle highlights high co-expressing samples. (d) Box and whisker plot of expression of ACE2 between normal large intestine (Grey, TCGA and GTEx) and colon and rectal cancer (Red, TCGA) samples. Median +/- IQR. One-way ANOVA. ***, P < 0.001. TPM = Transcripts per million. (e) Box and whisker plot of expression of TMPRSS2 between normal large intestine (Grey, TCGA and GTEx) and colon and rectal cancer (Red, TCGA) samples. Median +/- IQR. One-way ANOVA. ***, P < 0.001. TPM = Transcripts per million. (f) Box and scatter plot of ACE2 expression levels from TCGA COAD/READ data sets between tumour subtypes CIN = chromosomal instability, MSI = microsatellite instability, GS = genome stable and POLE = DNA polymerase epsilon. Median +/- IQR. Kruskal-Wallis. ***, p < 0.001.
