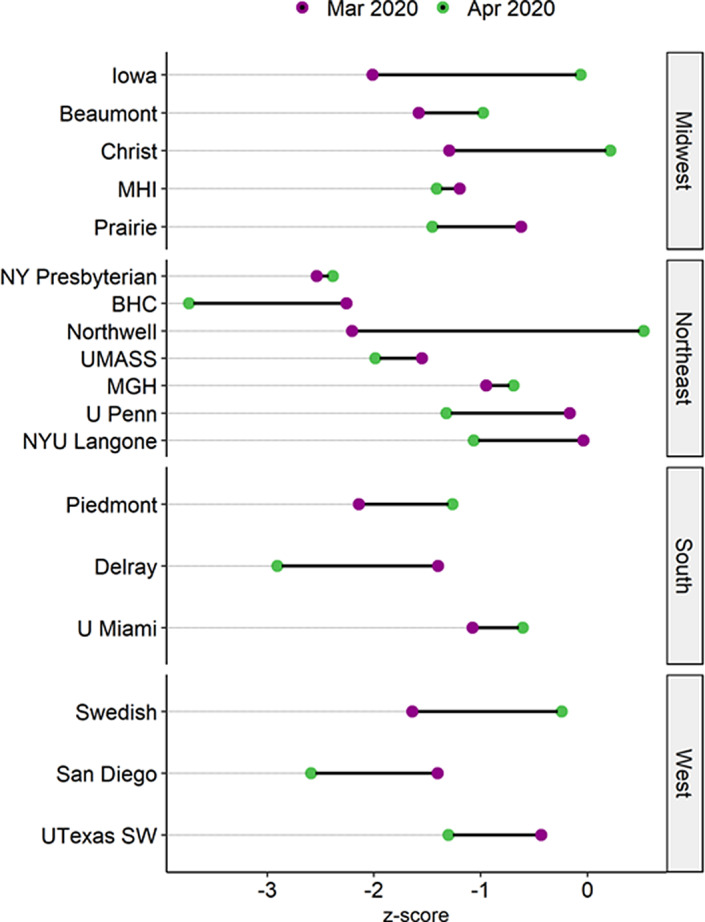
FIGURE 2.

A dumbbell plot of Z‐scores showing changes in cardiac catheterization laboratory ST‐elevation myocardial infarction activations for each program. Units are standard deviations from their BC means, for example, Z‐score = 0 indicates that the volume at a given month in 2020 is identical to the mean BC volume. A negative Z‐score indicates a decline in units of standard deviations from their mean BC volumes. All programs saw a decline in March 2020 (Z‐scores marked by purple dots are all negative) with some recovering in April to nearly 2019 volumes (e.g., Iowa, Christ Hospital, Northwell, Swedish) and others either nearly unchanged (e.g., NY Presbyterian, MHI, MGH) or worsening (Prairie, Delray, BHC, U Penn, San Diego). BC, before COVID‐19 [Color figure can be viewed at wileyonlinelibrary.com]
