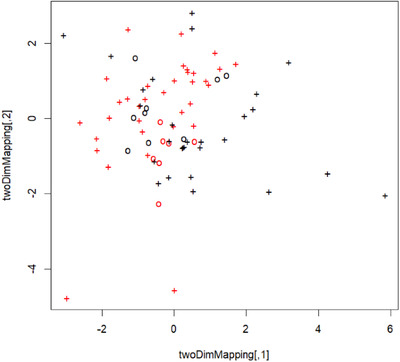
FIGURE 5.

Support vector machine visualization plot. Black cross indicates patients with IAP; red cross indicates patients with NCP; circle indicates misclassification or incorrect prediction; the X‐ and Y‐axis denote mapping variables for two‐dimensional presentation of the multidimensional hyper‐plane
