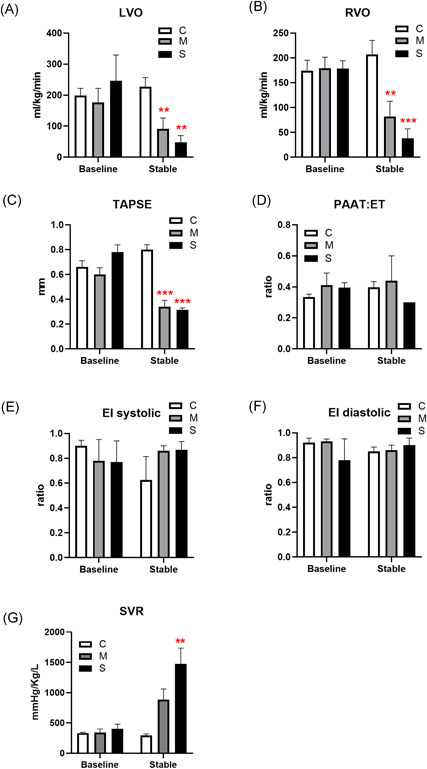
Figure 2.

Hemodynamics by echocardiography. Cardiac left (LVO; A) and right (RVO; B) ventricular outputs, tricuspid annular plane systolic excursion (TAPSE; C), ratio of pulmonary artery acceleration time to ejection time (PAAT:ET; D), systolic (E), and diastolic (F) eccentricity indices (EI), and systemic vascular resistance (SVR; G) measured at baseline and at end of study, represented as mean ± SE for each group (N = 5; **P < .01, ***P < .001 compared with the control group) [Color figure can be viewed at wileyonlinelibrary.com]
