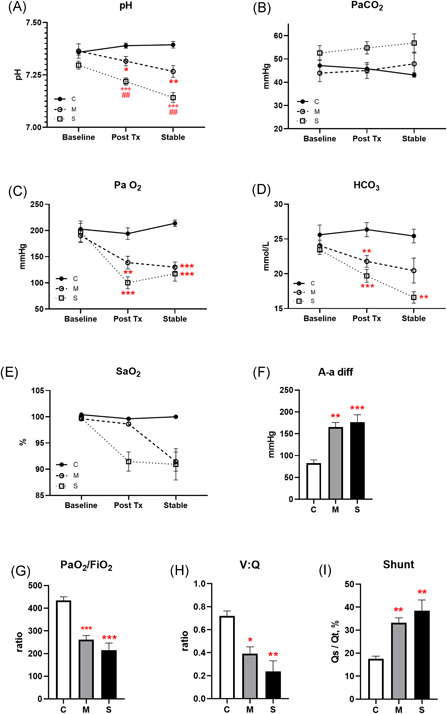
Figure 4.

Blood gases and calculated lung injury. Arterial pH (A), PaCO2 (B), PaO2 (C), HCO3 (D), and arterial oxygen saturation (SaO2; E) measured at baseline, 1 hour posttreatment and at end of study, represented as mean ± SE for each group. Alveolar‐arterial difference (A‐a diff; F), ratio of PaO2:FiO2 (G), ventilation to perfusion ratio (V:Q, H) and intrapulmonary shunt fraction (I) calculated from measured parameters at end of study (N = 5; *P < .05, **P < .01, ***P < .001 compared with the control group; ## P < .01 compared with the moderate group) [Color figure can be viewed at wileyonlinelibrary.com]
