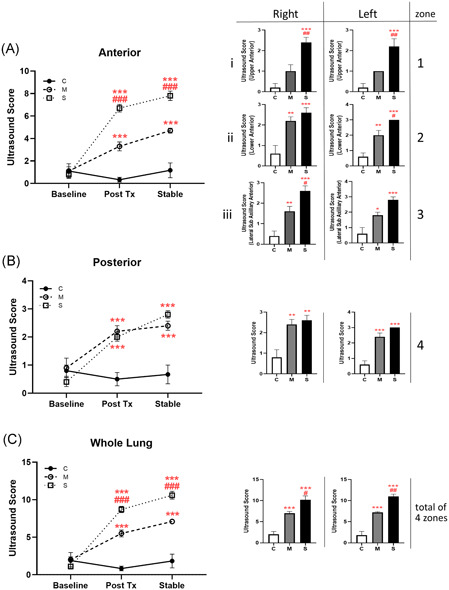
Figure 5.

Ultrasound lung injury score. Ultrasound images captured at baseline, 1 hour posttreatment and at end of study; scores are represented as mean ± SE for each group. Anterior measurements (A) are cumulative values obtained from (i) upper, (ii) lower, and (iii) lateral zones; posterior values (B) obtained from a single posterolateral zone per lung. (C) Total lung ultrasound score is the sum of anterior (three zones) and posterior (one zone) images per lung. Histograms show the measurement at the stabilized timepoint for individual zones studied. (N = 5; *P < .05, **P < .01, ***P < .001 compared with the control group; # P < .05, ## P < .01, ### P < .001 compared with the moderate group) [Color figure can be viewed at wileyonlinelibrary.com]
