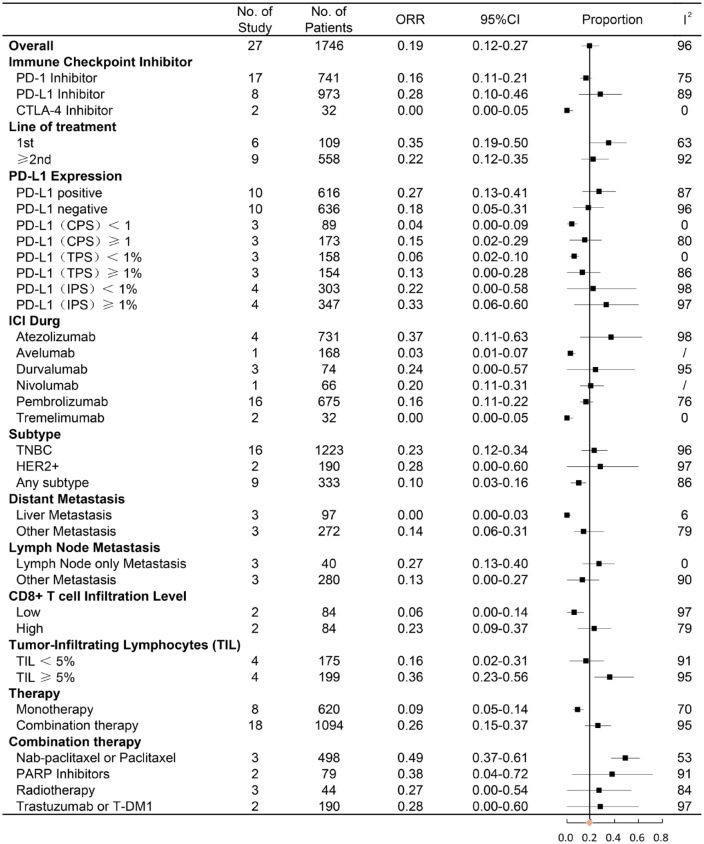
Figure 2.
Forest plot of subgroup analysis of ORR in different immune checkpoint targets, line of ICI therapy, PD-L1 expression, ICI drug, subtype of breast cancer, metastatic site, CD8+ T-cell infiltration level, tumor-infiltrating lymphocytes, and combination therapy.
CI, confidence interval; CPS, combined positive score; HER2+, human epidermal growth factor receptor 2; IPS, immune cell proportion score; ORR, objective response rate, PARP inhibitors, poly ADP-ribose polymerase inhibitors; TPS, tumor proportion score; TNBC, triple-negative breast cancer.

