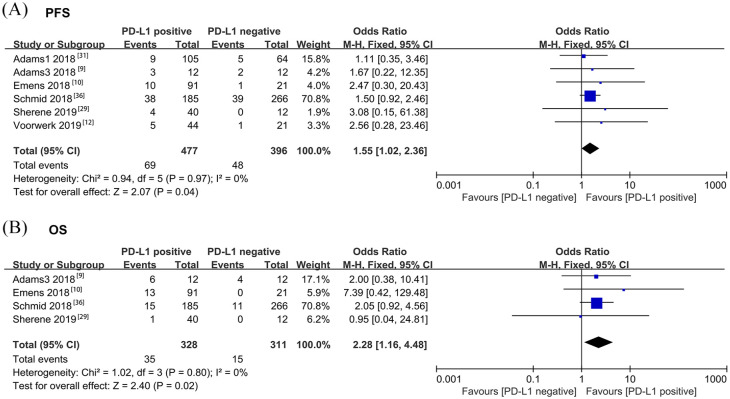
Figure 4.
Forest plots of comparison of (A) PFS rate at the first year and (B) OS rate at the second year based on PD-L1 expression level after receiving ICI treatment.
Odds ratio for each study is presented, and horizontal lines indicate the 95% CI.
CI, confidence interval; ICI, immune checkpoint inhibitor; OS, overall survival; PFS, progression-free survival.

