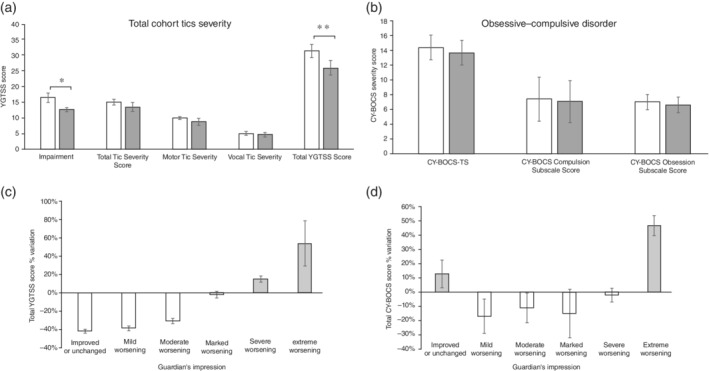
Fig. 1.

(a) ( ) Pre‐lockdown and (
 ) post‐lockdown Yale Global Tic Severity Scale (YGTSS) subscale scores in the total cohort. (b) (
 ) Pre‐lockdown and (
 ) post‐lockdown comparison of CY‐BOCS score. (c) Mean percentage change of YGTSS scores according to the guardian's impression. (d) Mean percentage change of CY‐BOCS‐TS according to the guardian's impression. TS, total score. Error bars indicate standard errors. *P < 0.05 on paired t‐test. **P < 0.01 on paired t‐test.
