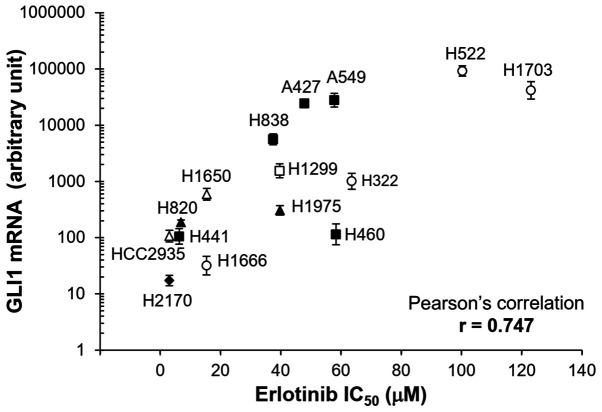
Figure 2.
Correlation between GLI1 mRNA expression levels and erlotinib sensitivity. GLI1 expression in the different cell lines were measured using reverse transcription-quantitative PCR and normalized to GAPDH using 2−ΔΔCq method (47). The error bars represent SDs from three experiments. Different symbols represent cell lines with different types of mutations. Open triangle, cells with EGFR sensitizing mutation (HCC2935 and H1650, both with E19del); filled triangle, cells with EGFR sensitizing mutation and resistant mutation (H820, 19del and T790M; H1975, L858R and T790M); filled square, cells with KRAS mutation (H441, G12V; H838, G12C; A427, G12D; A549, G12S; H460, Q61H); open square, cells with NRAS mutation (H1299, Q61K); filled diamond, cells with RAS family mutation (H2170, RHOA G17V); open circle, cells without common driver mutations in EGFR and RAS family (H1666, H322, H522, H1730).

