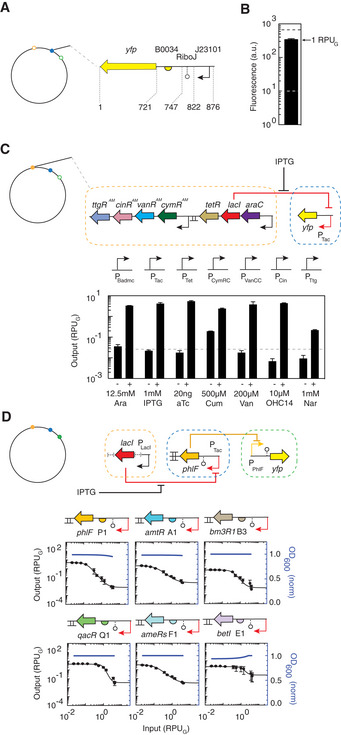
Figure 2. Characterization of genetic sensors and gates in the genome.

- The reference promoter and construct used for the calculation of RPUG are shown.
- The strength of the RPUG reference promoter is shown. Gray dotted line shows autofluorescence level, and the black dotted line shows the RPU reference characterized on a p15a plasmid (Nielsen et al, 2016; Shin et al, 2020). The means of three experiments performed on different days are shown, and the error bars are the standard deviation of these measurements.
- The sensor array is shown; genetic parts are provided in Appendix Table S5. The output promoters associated with each sensor is shown at the top of the bar graph. The detailed characterization of the sensors, including ON/OFF values and response functions, is shown in Appendix Fig S5 and Appendix Table S3. The means of three experiments performed on different days are shown, and the error bars are the standard deviation of these measurements.
- Characterization of NOT gates. The […] in the construct represent portions of the sensor array not including in the schematic for clarity. Response functions were measured for the following 12 concentrations of IPTG: 0, 2, 5, 10, 20, 40, 60, 80, 100, 200, 400, and 500 μM. The x‐axis was converted to RPUG by separately measuring the activity of the IPTG‐inducible promoter for these inducer concentrations (Appendix Fig S12). Each response function was fit to the Hill equation (Materials and Methods), and the fit parameters are provided in Table 1. The means of three experiments performed on different days are shown, and the error bars are the standard deviation of these measurements. The blue lines show the impact on cell growth (OD600) when the input promoter to the gate is turned on (Materials and Methods). The smooth line is a linear regression to data from twelve inducer concentrations repeated over 3 days (Appendix Fig S8).
