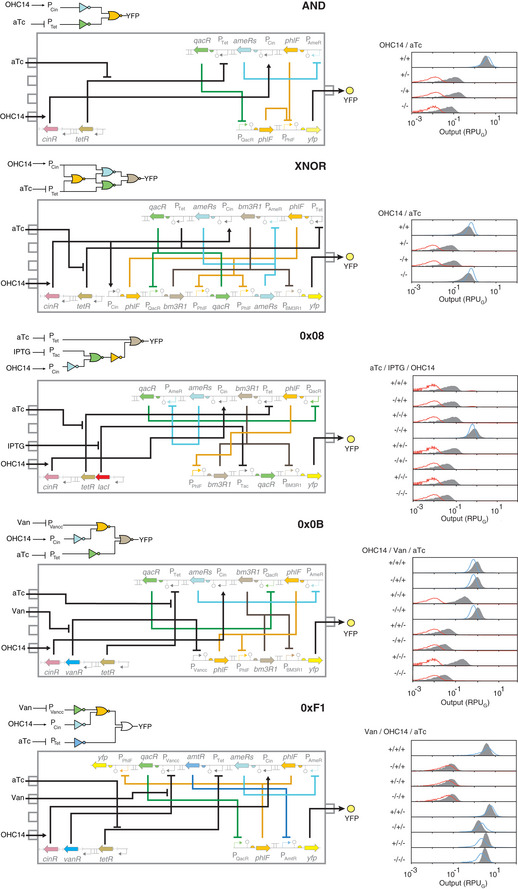
Figure 4. Genome‐encoded genetic circuits designed by Cello.

The wiring diagrams are shown with gates colored by the repressor identity. The gray boxes show the genetic circuit, with the construct in Landing Pad #1 at the top and Landing Pad #2 at the bottom. The genetic sensors used for the circuit are shown to the bottom left; all circuits use the same sensor array (Landing Pad #3), and […] indicates portions of it not visualized for clarity. The concentrations of inducers used are 1 mM IPTG, 20 ng/μl aTc, 200 mM vanillic acid, and 10 μM of OHC14. The distributions predicted by Cello are shown in blue or red, and the gray distributions are the experimental measurements. The experiments were repeated three times on different days with similar results (error bars shown in Appendix Fig S10).
