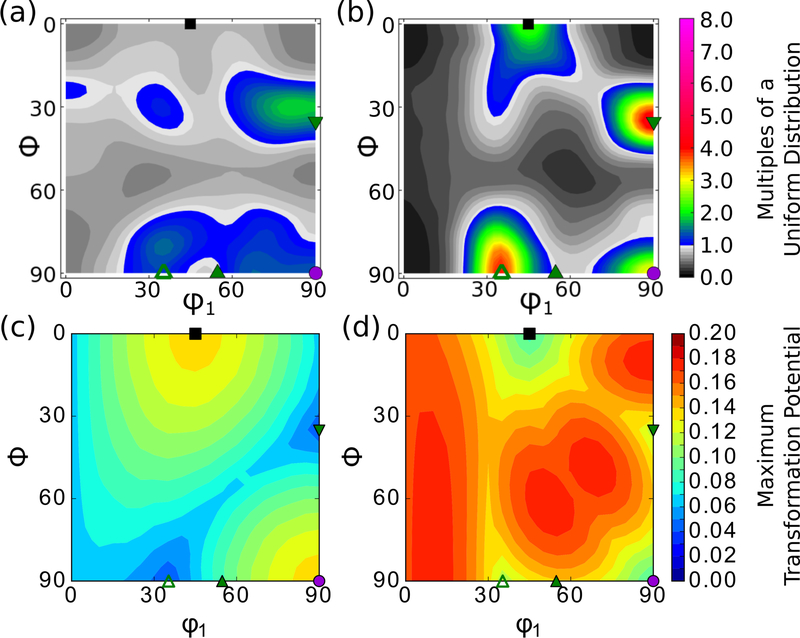
Figure 2.
a) ODF of the as-received austenite texture. b) ODF of the austenite texture after uniaxial deformation along the rolling direction to 27% engineering strain. c) Maximum transformation potentials for γ → α′ martensite transformation as a function of orientation (reproduced from ref.[8]). d) Maximum transformation potentials as a function of orientation for γ → ε martensite transformation. All plots are on the ϕ2=45° cross sections and austenite crystal reference frame. The color scale for the ODFs are the same for both ODFs and have values of multiples of a uniform distribution (MUD). The scale for the transformation potential is also shared between (c) and (d), and assumes a stress value of 1 along the rolling direction. The units on the transformation potential are . Marks for specific orientations are superimposed on each of the plots, as in Figure 1.

