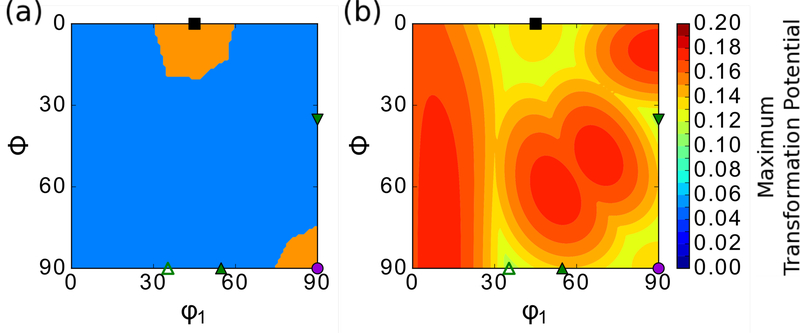
Figure 3.
a) Map of the transformation path activity. Regions in blue indicate the maximum transformation potential for the γ → ε transformation is larger than γ → α′. Regions in orange indicate the maximum transformation potential for the γ → α′ transformation is larger than γ → ε. b) Maximum transformation potential values for either the γ → α′ martensite transformation or the γ → εmartensite transformation.

