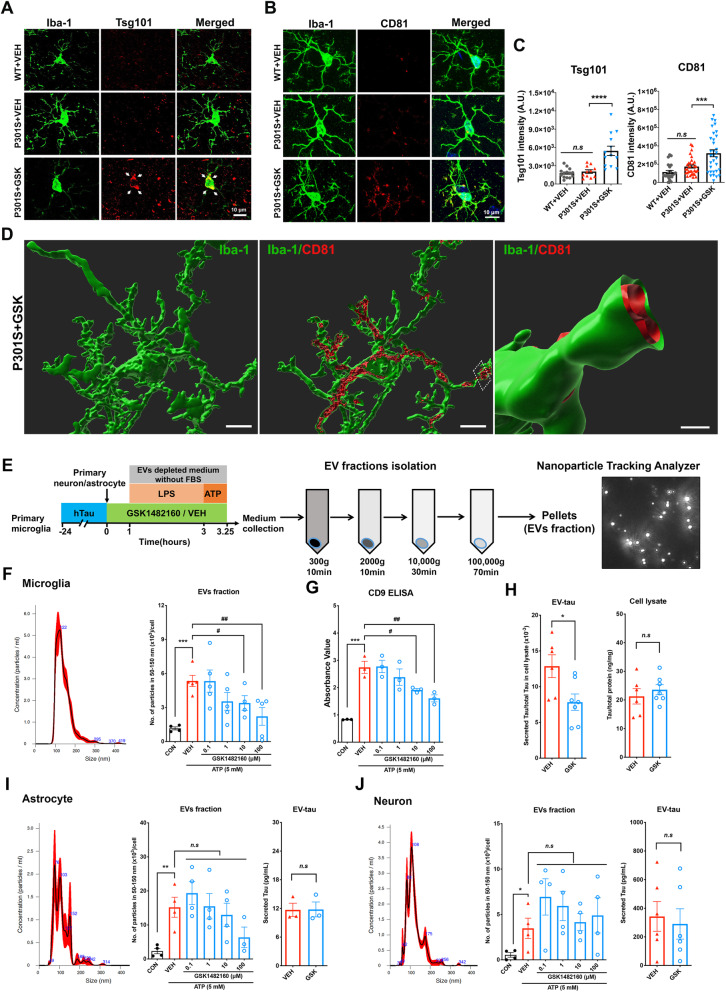
Fig. 5.
GSK1482160 treatment induced exosomal accumulation in microglia in P301S mice in vivo and suppressed microglial EV secretion in vitro. a-b. Immunofluorescence images of mouse hippocampal CA1 regions captured by the laser-scanning confocal microscopy. Iba-1 (green) co-stained with Tsg101 (red, left panel) and CD81 (red, right panel). c. Quantitative analysis of Tsg101 and CD81 florescent intensity in Iba-1+ positive cells: ***p < 0.001, ****p < 0.0001, P301S + GSK compared with P301S + VEH group, n.s denotes no significance as determined by one-way ANOVA (alpha = 0.05) and Dunnett’s post-hoc. Each dot represents an individual cell, Tsg101: n = (15, 13, 13) and CD81: n = (25, 32, 32) for (WT + VEH, P301S + VEH, P301S + GSK1482160) from 5 to 7 animals per group. Graphs indicate mean ± s.e.m. d. Re-constructed structure of exosome in microglia by Imaris software from P301S + GSK1482160 group. Membrane bound CD81(red) is shown in microglial processes (green). Scale bar 5, 5 and 2 μm. e. Scheme of EV isolation protocol from primary culture microglia, astrocyte and neuron conditioned media, followed by NTA of isolated EVs. Microglia were stimulated by LPS and ATP. All of the cells were pretreated by GSK1482160 or vehicle. f-h. EVs were isolated from the culture media of primary microglia without stimulation of ATP (control) or stimulated by 5 mM ATP and treated by either vehicle or GSK1482160 (0.1-100 μM). NTA plot of mode size and concentration (F left), particle numbers (f right), and CD9 ELISA (g) of microglial EVs. Total tau ELISA for the EV fraction and cell lysate from microglia pretreated with the vehicle or 10 μM of GSK1482160 (h). i-j. NTA and tau ELISA of isolated EVs from primary astrocyte (i) and neuron (j). *p < 0.05, **p < 0.01 and ***p < 0.001 compared with Control group; #p < 0.05 and ##p < 0.01 compared with ATP-treated group; n.s denotes no significance as determined by one-way ANOVA (alpha = 0.05) and Dunnett’s post-hoc; Student’s t-test for the total tau ELISA. Data are representative of at least three independent experiments. Graphs indicate mean ± s.e.m.

