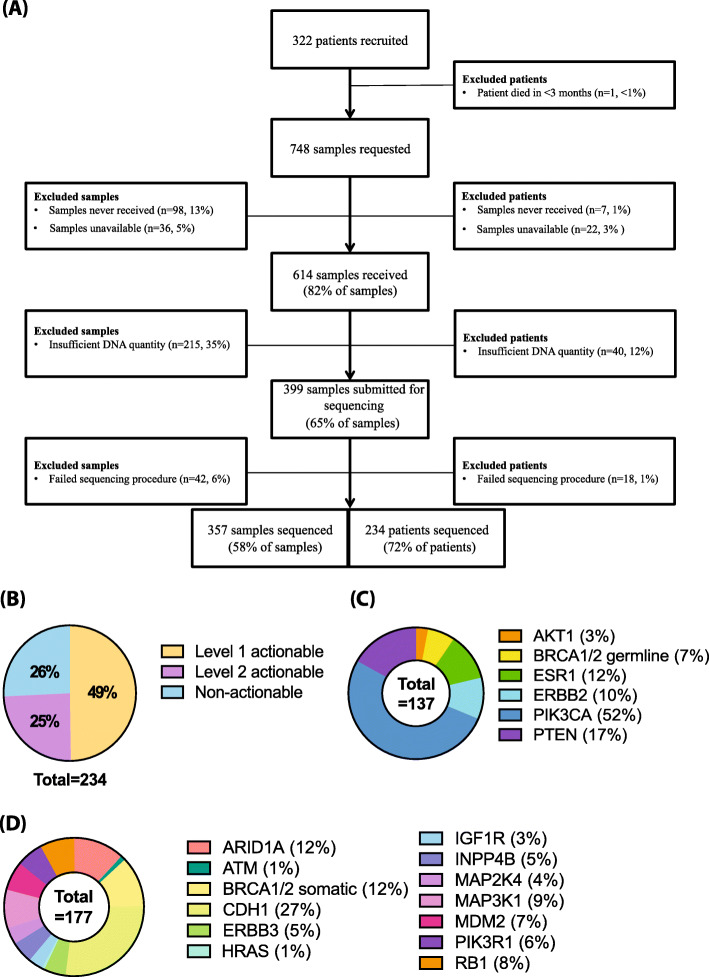
Fig. 1.
Study cohort. a Recruitment and specimen retrieval flow chart. Sample information and numbers are shown on the left of the central chart and patient information and numbers are shown on the right. b Actionable alterations. Pie chart shows the percentage breakdown of patients and the level of actionable alterations their samples contain. Patients with at least one level 1 actionable alteration amounted to 49% (n = 114). Patients with a level 2 actionable alteration accounted for 25% (n = 57). Patients without an actionable alteration amounted to 26% of the cohort (n = 60). c Level 1 actionable alteration breakdown by number of samples. AKT1 mutations (3%, n = 4), BRCA1/2 germline variants (7%, n = 9), ESR1 mutations (12%, n = 16), ERBB2 mutations (10%, n = 14), PIK3CA mutations (52%, n = 71) and PTEN mutations (17%, n = 23). ERBB2 amplifications are not included. d Level 2 actionable alteration breakdown by number of samples. ARID1A mutations (12%, n = 21), ATM mutations (1%, n = 2), BRCA1/2 non-germline mutations (12%, n = 21), CDH1 mutations (27%, n = 48), ERBB3 mutations (5%, n = 9), HRAS mutations (1%, n = 1), IGF1R mutations (3%, n = 6), INPP4B mutations (5%, n = 9), MAP2K4 mutations (4%, n = 7), MAP3K1 mutations (9%, n = 16), MDM2 amplifications (7%, n = 12), PIK3R1 mutations (6%, n = 11) and RB1 mutations (8%, n = 14)

