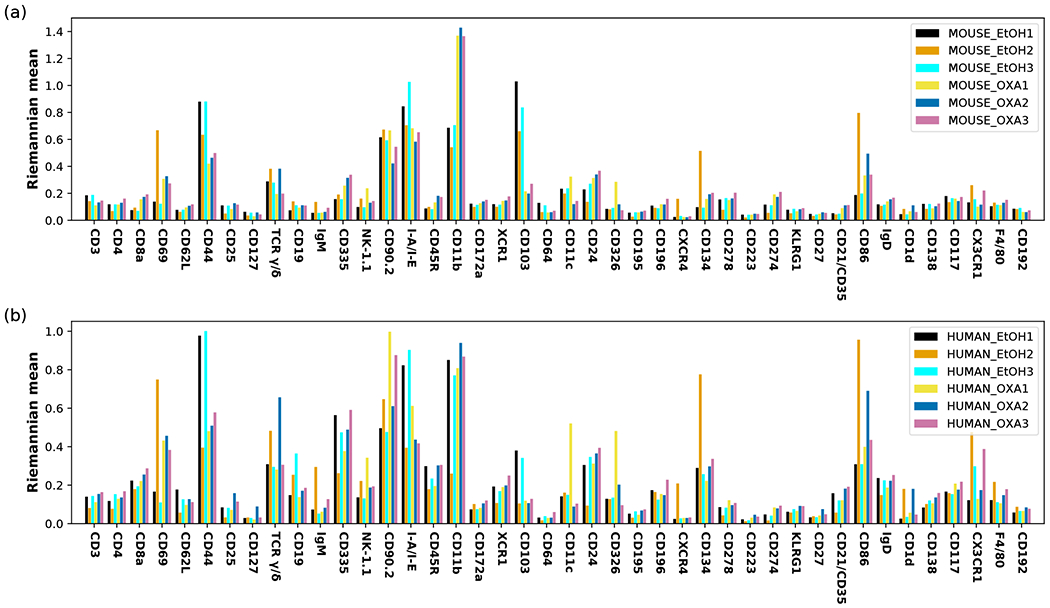
FIG. 3.

Batch effects within the three oxazolone-treated samples (OXA1,2,3) and the three control samples (EtOHl,2,3) of mouse skin cells, (a) Riemannian mean of the native mouse cells from each sample, (b) Riemannian mean of the spiked-in human cells from each sample. All proteins measured are included (D = 42). The bar height corresponds to the component of the Riemannian mean in the direction indicated on the ;r-axis.
