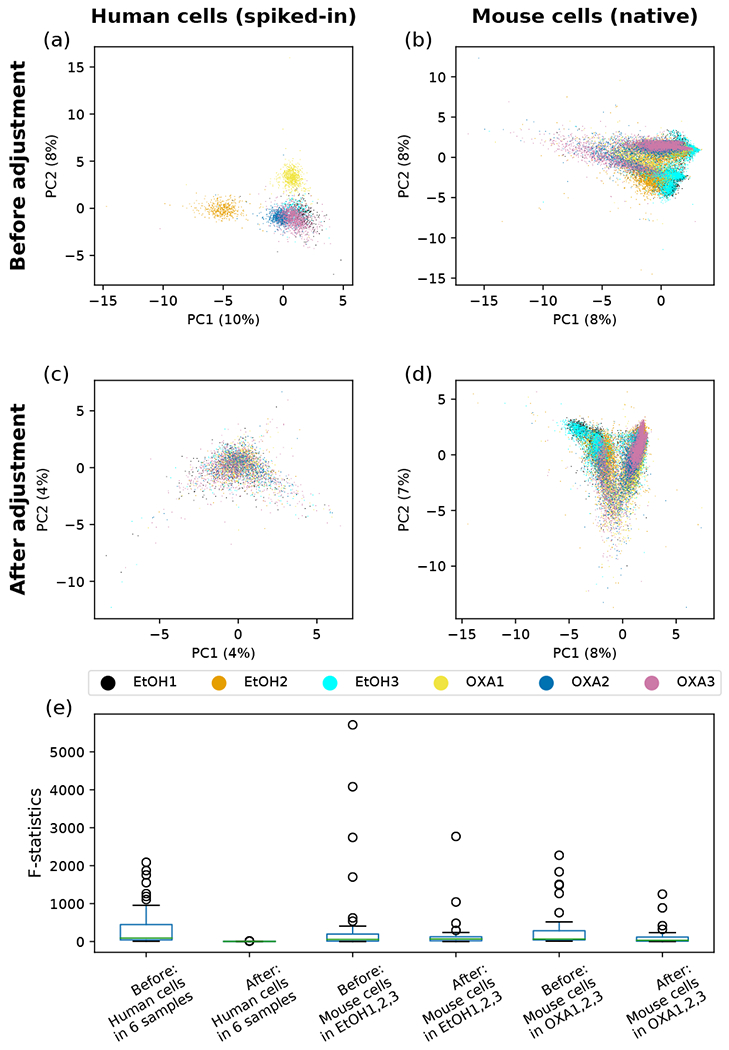
FIG. 4.

Principal component analysis (PCA) and the analysis of variance (ANOVA) of spiked-in human cells and native mouse cells on the probability simplex before and after batch correction. The single-cell ADT count data of surface proteins were transformed to probability vectors, which were then projected to the plane spanned by the first two principal components (PCs) for the PCA plots (a-d) and on which ANOVA was performed, (a) Spiked-in human data before batch correction. One control sample (EtOH2) and two treated samples (OXA1,2) are seen to be outliers from the rest, (b) Mouse data before batch correction. The biases observed in (a) are seen to be carried over here, (c) Spiked-in human data after batch correction. Point clouds of all six samples are seen to overlap well, (d) Mouse data after batch correction. Points from the six samples are seen to align well with respect to the two treatment conditions, (e) Distribution of the F-statistics from ANOVA for 41 surface proteins before and after the batch correction in six murine skin samples.
