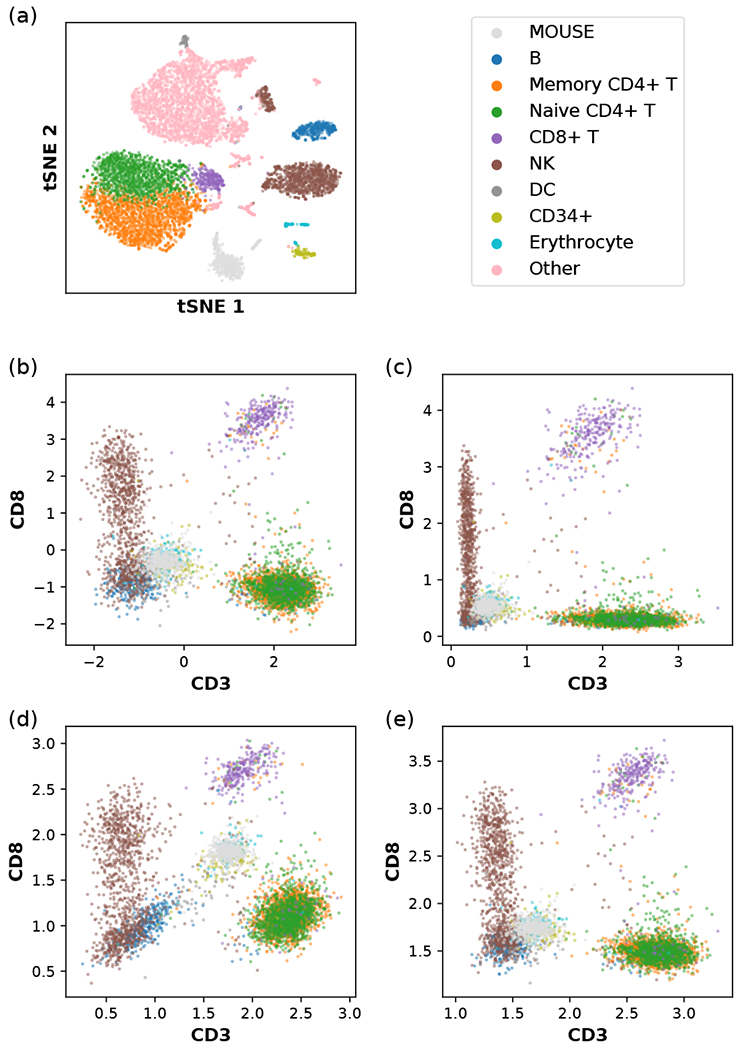
FIG. 7.

Data transformation applied to human CBMC with spiked-in mouse cells, (a) tSNE plot of the single-cell transcriptomic (scRNA-seq) data. The RNA count data, have been log-normalized, as described in Eq. (D1), and compressed using a dimensional reduction method (Appendix A). The indicated color scheme for cell types is carried over to (b,c,d,e). NK and DC denote natural killer cells and dendritic cells, respectively. CD14+ monocytes, CD16+ monocytes, megakaryocytes, and plasmacytoid dendritic cells (pDCs) are grouped into the category “Other” and omitted in other panels. (b) A version of the centered log ratio (CLR) transformation of the single-cell immunophenotype data, as described in Eq. (D2). (c) Another version of the CLR transformation of the single-cell immunophenotype data, as described in Eq. (D3). (d) Our data transformation method using the relative size factor ti = ai/a0, with ai being the arithmetic mean of count per protein, as described in Eq. (D6). (e) Our data transformation method using the relative size factor ti = gi/g0, with gi being the geometric mean of count (plus one pseudocount) per protein, as described in Eq. (D7).
