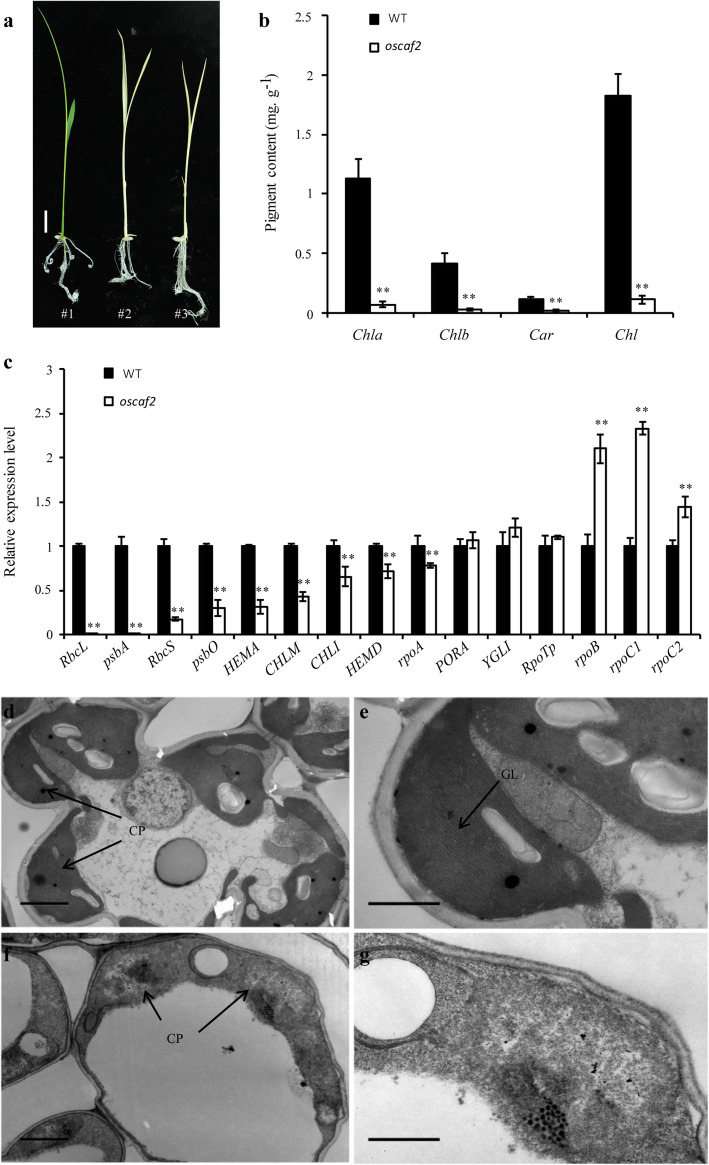
Fig. 2.
Chloroplast development was impaired in the oscaf2 mutant. a Phenotype presentation of WT (#1) and oscaf2 mutant (#2 and #3). Scale bar = 1 cm. b Chlorophyll contents of WT and oscaf2 at the two leaf stage. c Expression analysis of chloroplast synthesis and photosynthesis-related genes in WT and the oscaf2 mutant. The values represent the mean of three independent experiments. Error bars indicate SE, ** indicate P < 0.01, respectively. d-g The chloroplast ultrastructure of WT and oscaf2 mutants from leaves. WT (d, e) and oscaf2 mutants (f, g). CP, chloroplast, GL, grana lamella. Scale bars of d and f, 2 μm, Scale bars of e and g, 1 μm

