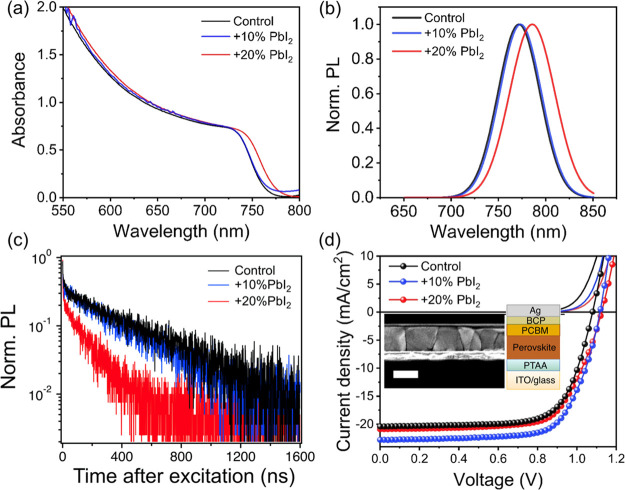
Figure 3.
UV–Vis absorption (a) and normalized photoluminescence (PL) (b) spectra (excitation at 520 nm) of evaporated FA0.7Cs0.3Pb(I0.9Br0.1)3 perovskite films with different quantities of excess PbI2 with respect to the stoichiometric control sample. (c) TRPL measurements for the different perovskite films with excitation at 407 nm (repetition rate of 0.5 MHz, fluence of 5 nJ/cm2/pulse). (d) J–V curves of evaporated perovskite solar cells with different quantities of excess PbI2 measured under AM 1.5G (100 mW/cm2 irradiance), along with corresponding dark curves. The curves are from the reverse scan (sweeping from 1.2 V to −0.1 V). A cross-sectional SEM image (scale bar is 500 nm) and a schematic of the employed solar cell architecture are shown in the inset.

