Figure 2.

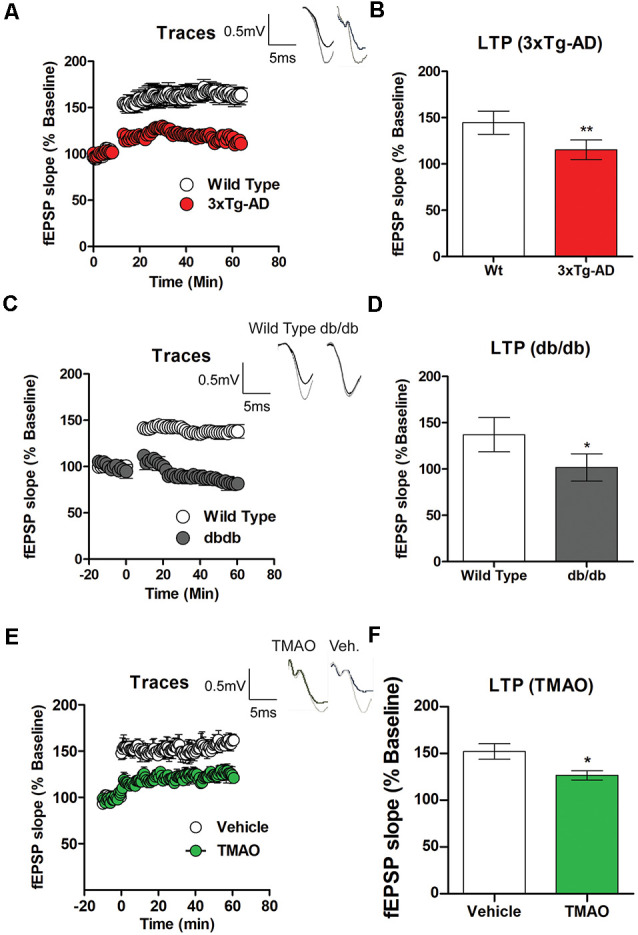
Deficits in long term potentiation (LTP) are noted in 3×Tg-AD and db/db mice. Hippocampal slices from control, 3×Tg-AD, and db/db mice were incubated for 2 h in artificial cerebral spinal fluid (ACSF) before recording. (A) LTP graph represents field excitatory postsynaptic potential (fEPSP) slope before and after induction by theta burst stimulation (TBS) in control (wild type) and 3×Tg-AD mice aged 8 months. (B) LTP bar graph shows fEPSPs recorded during the period 50–60 min following TBS induction normalized to baseline levels. (C) LTP graph comparing control (wild-type) and db/db mice aged 8 months and (D) bar graph representing fEPSPs during 50–60 min following TBS induction normalized to baseline levels. Hippocampal slices from control mice were incubated in ACSF with either 0.03% dimethyl sulfoxide (DMSO; vehicle) or TMAO (50 μM) for 4 h before recording. (E) LTP graph represents fEPSP slope before and after induction by TBS in vehicle-treated and TMAO treated slices. (F) LTP bar graph shows fEPSPs recorded during the period 50–60 min following TBS induction normalized to baseline levels. Bars represent mean ± SEM; *indicates a significant difference between control (wild-type) and db/db or 3×Tg-AD mice and significant difference between vehicle vs. TMAO treated slices, *p < 0.05 for (A–D). Results are shown as mean ± SEM of three to four mice per group and *p < 0.05, **p < 0.01; n = 5–6 slices from four mice per group; for (E,F) n = 5–6 slices from four mice per group.
