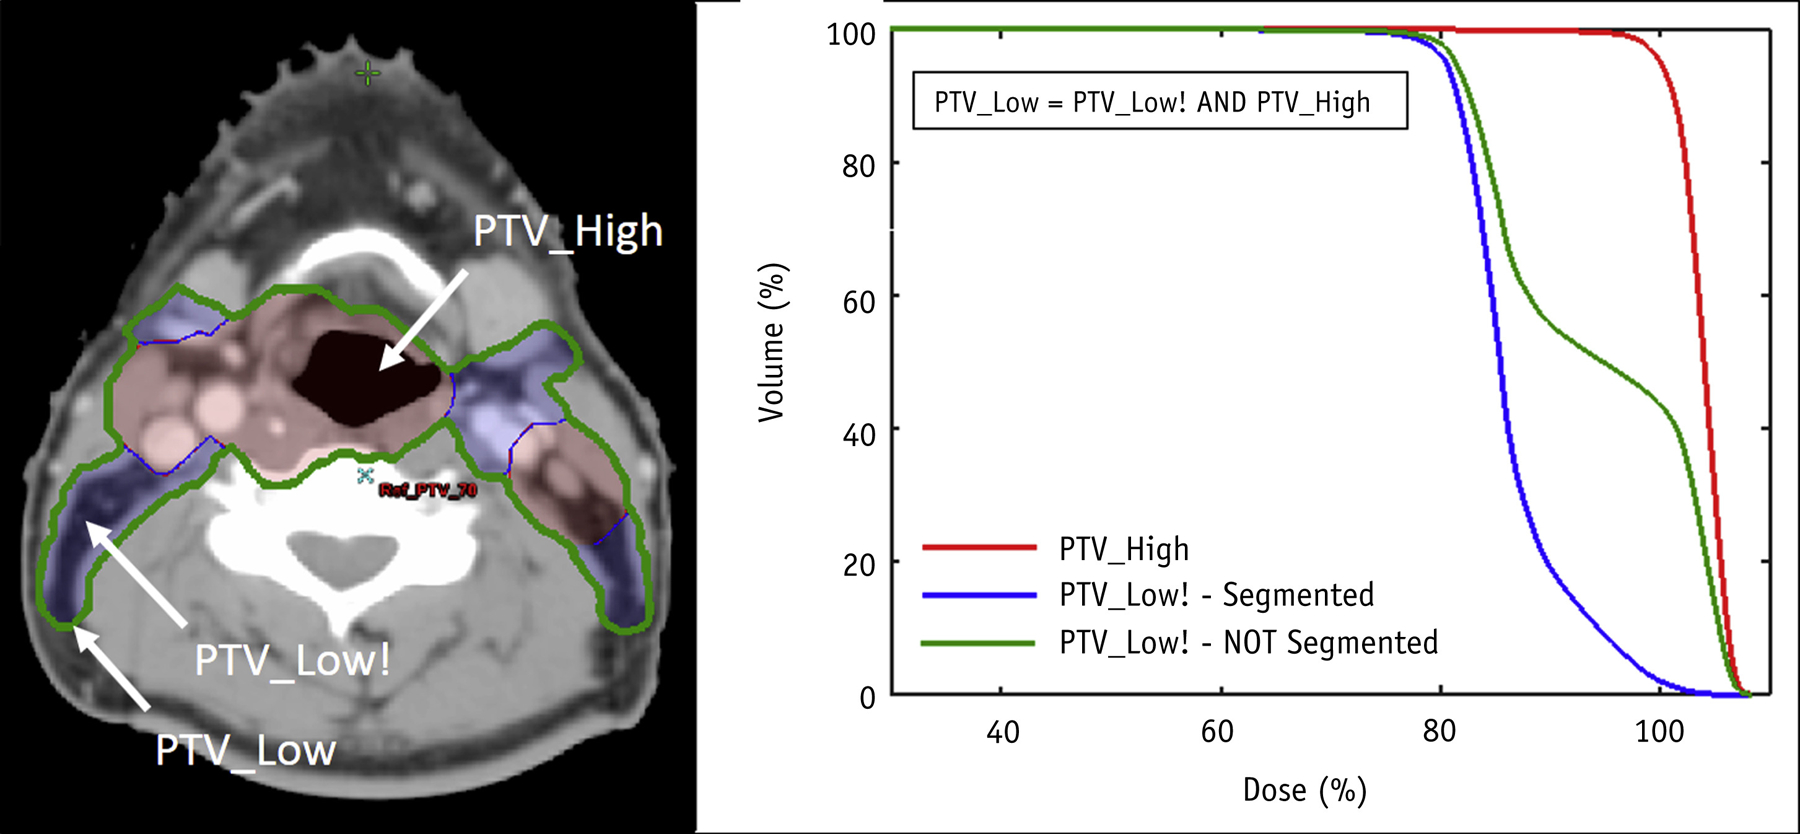
Fig. 3.

Illustration of dose–volume histogram differences when using segmented planning target volume (PTV) definitions, where the high-dose PTV (PTV_High, red curve) is not included as part of a lower dose PTV (PTV_Low, blue curve) compared with a nonsegmented approach, where the high-dose PTV is included in the lower dose PTV (PTV_Low, green curve). In this example, the volume of PTV_High is 55% of the volume of the nonsegmented PTV_Low.
