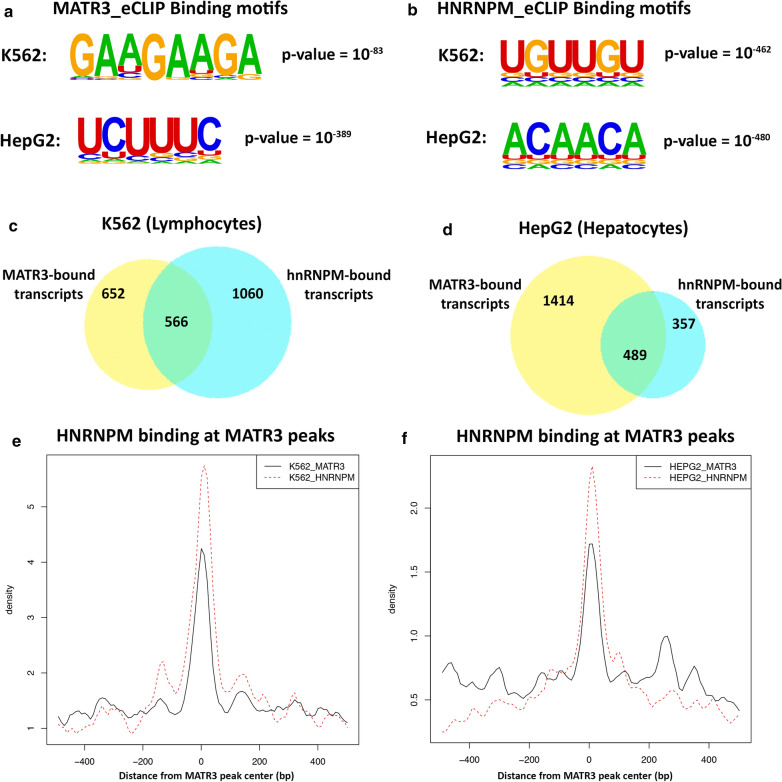
Fig. 7.
MATR3 and hnRNPM bind to shared transcriptomic targets. aMATR3 binding sites are significantly enriched primarily in AAGAA and UCUUU motifs in both K562 and HepG2 cells. MATR3 eCLIP (ENCODE) from K562 cells shows highest enrichment of AAGAA motif with p-value = 10−83, and MATR3 eCLIP from HepG2 cells shows highest enrichment of UCUUC motif with p-value = 10−389. b hnRNPM binding sites (ENCODE) are significantly enriched primarily in UGUUG and ACAAC motifs in both K562 and HepG2 cells. hnRNPM eCLIP from K562 cells shows highest enrichment of UGUUG motif with p-value = 10−462, and hnRNPM eCLIP from HepG2 cells shows highest enrichment of ACAAC motif with p-value = 10−480. c Venn diagram representing transcriptomic targets from in silico analysis of MATR3 eCLIP and hnRNPM eCLIP in K562 cells (lymphocytes) and d HepG2 cells (hepatocytes). Significantly enriched MATR3 and hnRNPM eCLIP peaks were identified (p-value < 0.05, fold change ≥ 4) and annotated to corresponding transcript. MATR3 and hnRNPM share transcriptomic targets in both cell types. e, f Read density plots showing normalized read density of hnRNPM eCLIP centered at significantly enriched MATR3 eCLIP peaks in e K562 cells and in f HepG2 cells. Read densities were normalized within a ± 400 nucleotide (nt) window around MATR3 peak center

