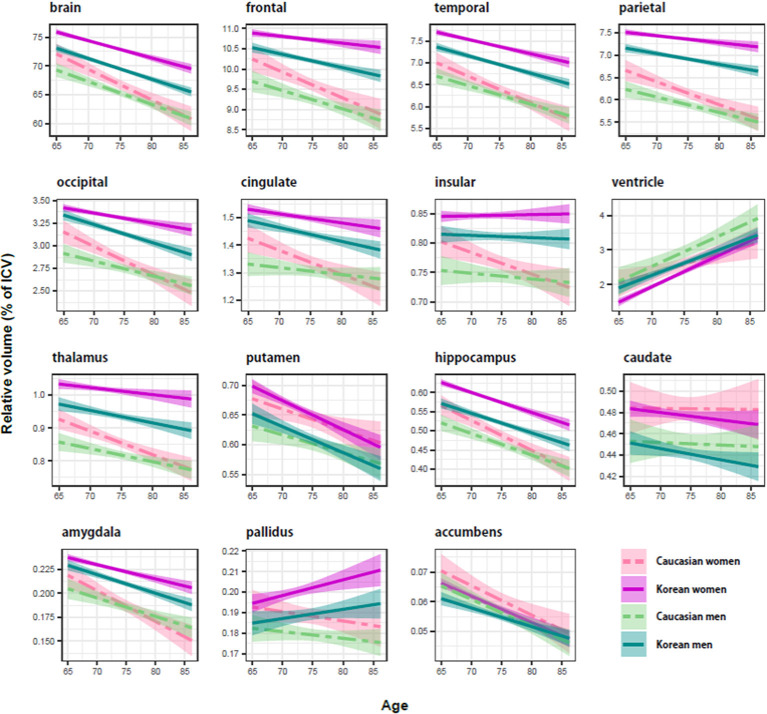
Figure 1.
Ethnicity and sex differences of the aging brain in relative size (percentage of intracranial volume). The shaded region around each trajectory shows ± 1 SE of the mean. In cortical structures, Koreans (solid line) seemed to be bigger than Caucasians (dashed line), and women (red line) appeared to be bigger than men (cyan line). Compared with the cortical structure, there were no consistent effects of ethnicity and sex on subcortical structures.

