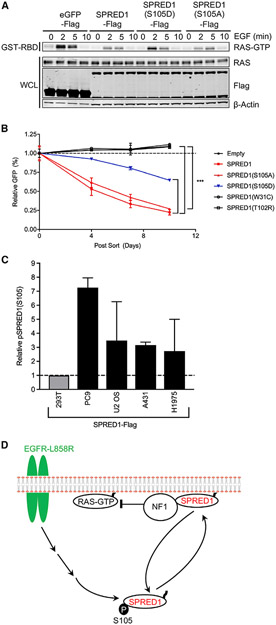
Figure 7. Phosphomimetic and Phosphodeficient SPRED1(S105) Alter RAS-GTP Signaling following EGF Stimulation and K562 Proliferation, along with a Model of SPRED1(S105) Phosphorylation.
(A) HEK293T cells were transiently transfected with indicated SPRED1-FLAG constructs, serum starved for 16 h, and stimulated with 10 ng/mL EGF for the indicted time points. Downstream signaling was then assessed by western blot and RAS-GTP pull-down assay.
(B) K562 cells were infected with SPRED1-IRES-GFP, SPRED1-IRES-GFP mutants, and empty vector expressing retrovirus. Three days after infection, baseline GFP-positive cells were measured by flow cytometry and normalized to 1. During this competition assay, GFP-positive cells were monitored over time to measure the effect of SPRED1 expression on proliferation. The statistical significance of the difference between indicated samples was determined using a two-way ANOVA: ***p < 0.001.
(C) Cancer cell lines were infected with SPRED1-FLAG-expressing retrovirus, selected with 1 μg/mL puromycin, anti-FLAG IP, and LC-MS/MS as described above. The y axis: MS1 chromatographic peak areas, arbitrary units relative to control.
(D) Oncogenic EGFR-mediated SPRED1(S105) phosphorylation model. Phosphorylated SPRED1(S105) is unable to bind NF1 and inhibit RAS-GTP signaling.
See also Figure S6.

