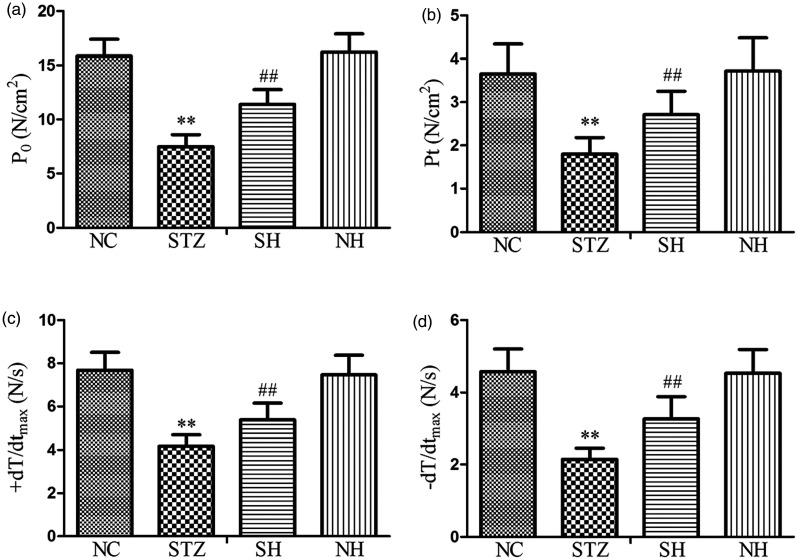
Figure 2.
The levels of (a) P0, (b) Pt, (c) +dT/dtmax, and (d) −dT/dtmax in the different groups. Values, mean ± SD; n = 8; **P < 0.01 vs. NC group; ##P < 0.01 vs. STZ group; NC: normal control group; STZ: streptozotocin group; SH: STZ + sodium hydrosulfide group; NH: NC + sodium hydrosulfide group.

