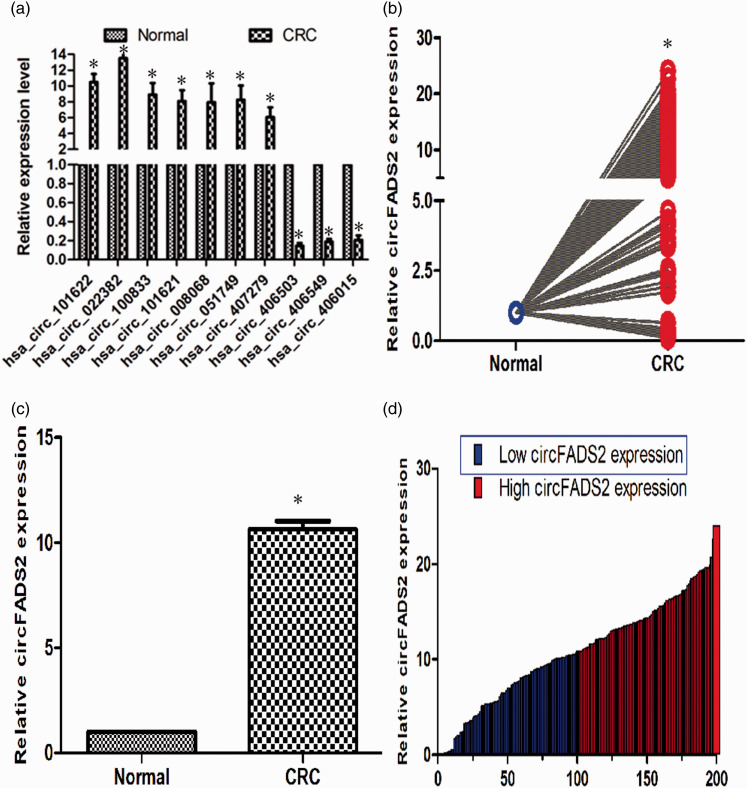
Figure 3.
qPCR validation analysis of the circular RNA expression in matched CRC and adjacent tissues. (a) qPCR verification analysis of the top 10 differential expressed circular RNA from microarray data. A total of seven upregulated circular RNA and three downregulated ones, which fold change >5 and P < 0.05, were validated (n = 3, *P < 0.01). (b) The average relative hsa_circ_022382 (named circFADS2) expression of CRC compared with corresponding normal tissues by qPCR (n = 200, *P < 0.01). (c) Relative circFADS2 level in CRC tissues compared with normal tissues (n = 200). (d) Relative circFADS2 expression of individual paired CRC and normal tissue (n = 200, *P < 0.01). The blue and red bar represent low and high circFADS2 expression, respectively. All experiments were performed in triplicates. GAPDH was used to normalize as reference gene. The data statistical significance is assessed by paired t-test. That P value less than 0.05 is considered statistically significant. (A color version of this figure is available in the online journal.)

