Figure 1.
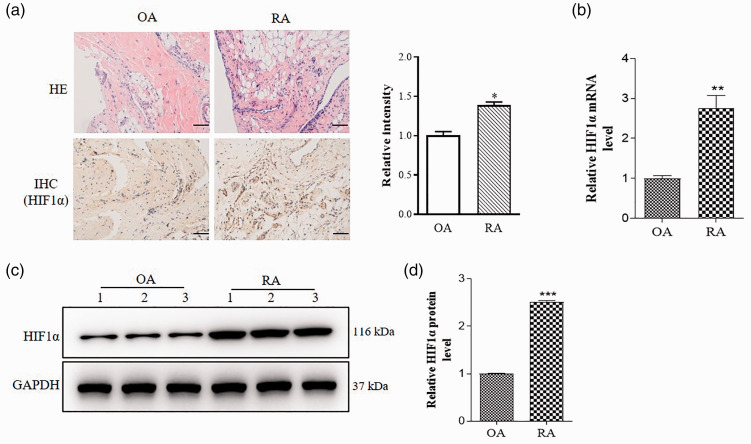
HIF1α expression is increased in RA. Synovial tissue was extracted from OA and RA model mice. (a) Representative images of HE staining and immunohistochemistry staining for HIF1α (brown color). Relative intensity of HIF1α was analyzed by Image J. Scale bar = 50 μm. (b) qRT-PCR was performed to examine relative values of HIF1α mRNA. (c) HIF1α protein expressions in synovial tissue of OA and RA mice were measured by Western blot. Each group is shown three representative blot images. (d) Relative values of HIF1α protein expressions were analyzed by Image J. Data are shown as mean ± S.E.M. *P < 0.05, **P < 0.01, ***P < 0.001, n = 6. (A color version of this figure is available in the online journal.)

