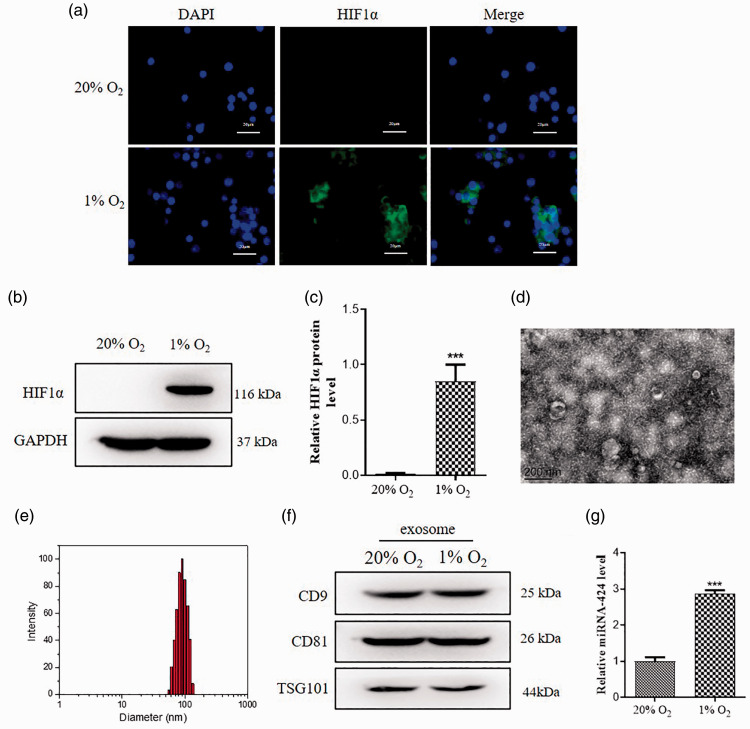
Figure 2.
Hypoxia induces exosomal miR-424 expression in SFs. Synovial fibroblasts were treated with 20% O2 or 1% O2 to establish cell model in vitro. (a) Representative images of immunofluorescence staining for HIF1α. HIF1α is shown as green color and the nuclei are shown as blue color. Scale bar = 20 μm. (b) HIF1α protein expressions in OA and RA mice were measured by Western blot. (c) Relative values of HIF1α protein expressions was analyzed by Image J. (d) Representative TEM images of exosomes. Scale bar = 200 nm. (e) The average diameter of exosome size analyzed by NTA system. (f) Exosomes marker CD9 and CD81, TSG101 in the CAFs lysate and CAFs-derived exosomes were detected by Western blot. (g) Relative values of CD9 and CD81, TSG101 protein expressions was analyzed by Image J. Data are shown as mean ± S.E.M. **P < 0.01, ***P < 0.001, n = 6. (A color version of this figure is available in the online journal.)

