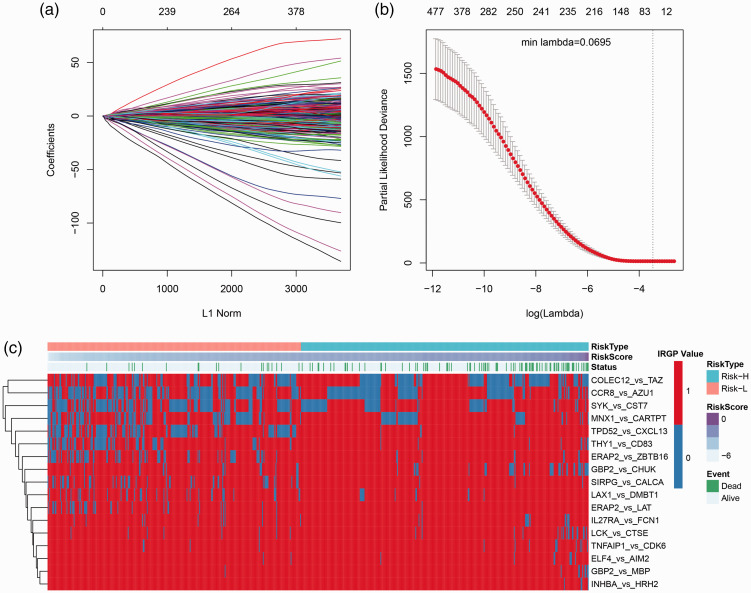
Figure 3.
Results of Lasso regression analysis. (a) The change trajectory of every autovariable, the horizontal axis indicating the logarithm of the autovariable λ, and the vertical axis indicating the coefficient of the autovariable. (b) The average error interval for each lambda. (c) Relationship between 66 IRGPs and risk score. (A color version of this figure is available in the online journal.)

