
FIGURE 3.
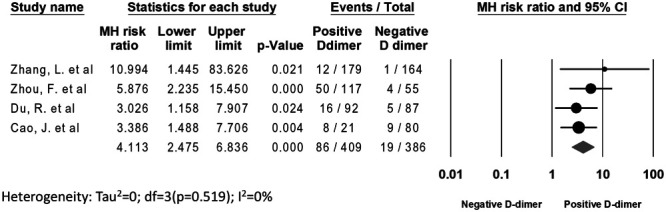
All-cause mortality. The Forest plot shows the outcomes of the individual trials as well as the aggregate.
Official websites use .gov
A
.gov website belongs to an official
government organization in the United States.
Secure .gov websites use HTTPS
A lock (
) or https:// means you've safely
connected to the .gov website. Share sensitive
information only on official, secure websites.
All-cause mortality. The Forest plot shows the outcomes of the individual trials as well as the aggregate.