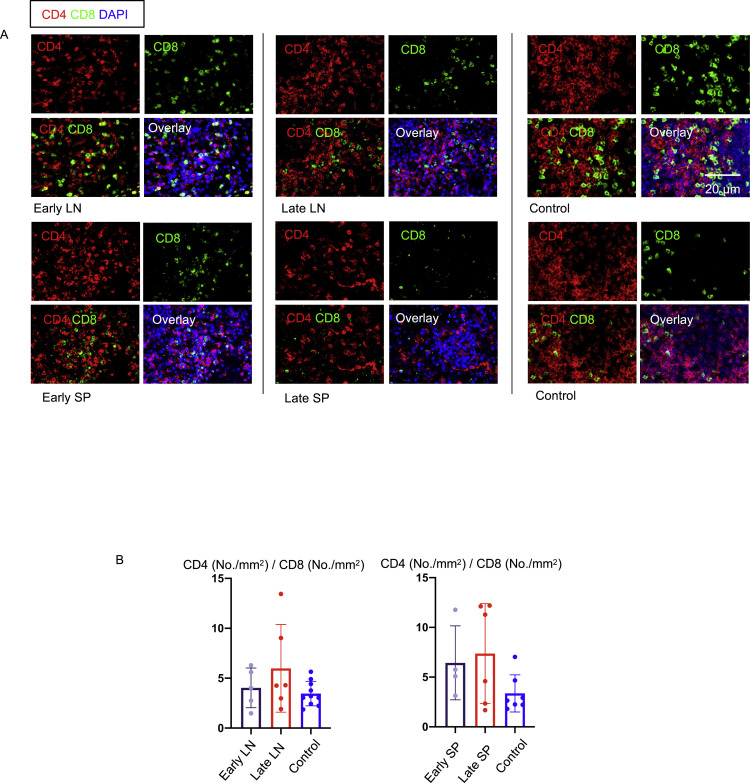
Figure S4.
Increase in CD4+/CD8+ T Cell Ratio in Lymph Nodes and Spleens in COVID-19, Related to Figure 4
(A) Representative multi-color immunofluorescence images of CD4 (red), CD8 (green) and DAPI (blue) staining in lymph nodes (top 2 rows of images) and spleens (bottom 2 rows of pictures) from early (left) and late (middle) COVID-19 patients and controls (right). (B) Relative ratios of CD4 and CD8 T cells (No./mm2) in lymph nodes (left) and spleens (right) from early (purple) (n = 5/4) and late (red) (n = 6) COVID-19 patients and controls (blue) (n = 10/7).

