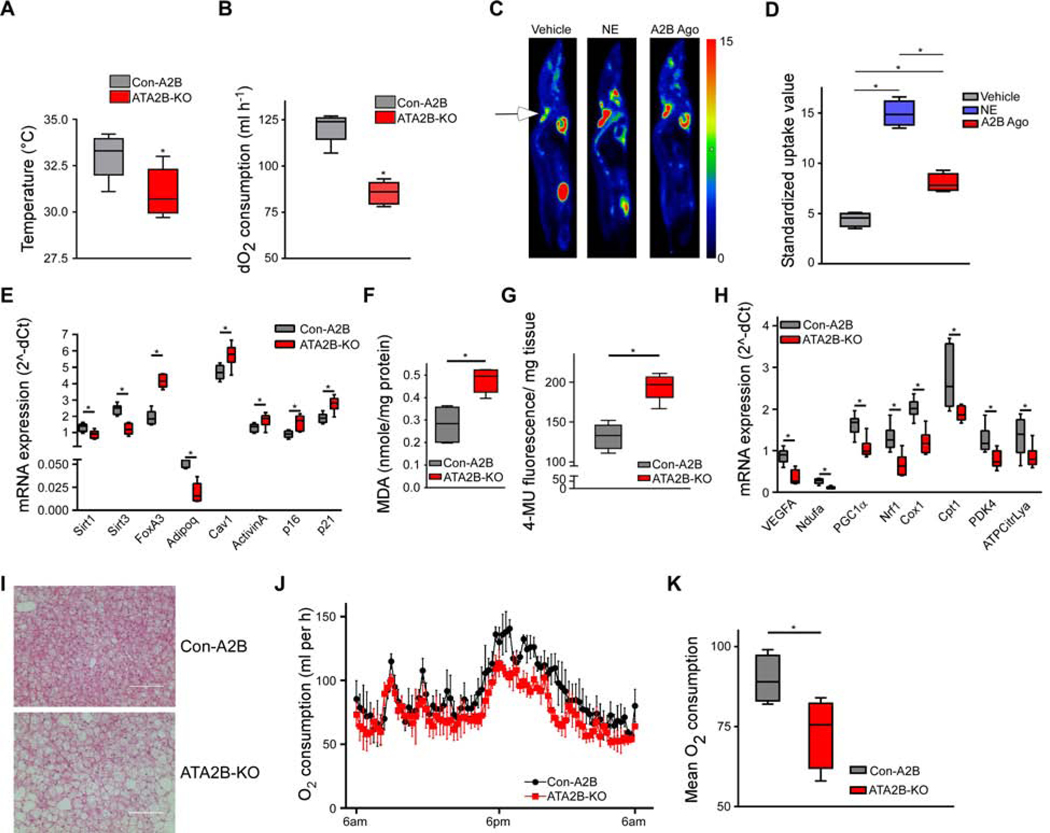
Figure 2. The role of A2B in BAT activation and ageing. See also Figure S2.
(A,B) Interscapular surface temperature quantified by infrared thermography (A) and relative oxygen consumption at 4°C ( B) of ATA2B-KO and Con-A2B mice (n=5). (C,D) PET/MRI [18F]FDG uptake imageing (C) and quantification (D) of mice treated with vehicle, NE (1 mg/kg), or A2B agonist (0.1 mg/kg) (n=4). Arrows indicate interscapular BAT. (E) Expression of ageing markers in BAT of ATA2B-KO and Con-A2B mice (n=6). (F,G) Abundance malondialdehyde (F) and senescence-associated Beta-galactosidase activity (G) in BAT of ATA2B-KO and Con-A2B mice (n=6). (H) Expression of oxidative metabolism and BAT whitening marker genes of ATA2B-KO and Con-A2B mice (n=6). (I) Representative HE stain of BAT of aged ATA2B-KO and Con-A2B mice (Scale bar 100 μm). ( J,K) Time-course (J) and average (K) of whole-body O2 consumption of ATA2B-KO and Con-A2B mice at 23° C (n=5). * P < 0.05. Data are shown as mean + SEM (J) or boxplot (with median) and whiskers (1.5x interquartile range) (A,B,D-H,K) and were analyzed with two-tailed student’s t-test (A,B,E-H,K) or ANOVA with Newman-Keuls post-hoc test (D).

